

Canton Network Quickstart observability & troubleshooting overview
The screenshots in this guide are taken from multiple sessions and are inconsistent with each other. This will be rectified once some of the updates are committed.
Overview of observability
The Canton Network quickstart deployment configuration includes a full observability suite. Tools preconfigured for monitoring and troubleshooting distributed Canton applications—both in development and production. The observability suite provides three key types of monitoring data:- consolidated structured logs for application and system events
- distributed traces that visualize end-to-end transaction flows; and
- metrics for monitoring key performance indicators.
The LocalNet configuration
The Quickstart runtime configuration is defined in.env.local, which allows the option to bring up a local deployment of the Observability Stack. This file can be created using $ make setup, which wraps the command $ ./gradlew configureProfiles --no-daemon --console=plain --quiet, or can be edited manually to set environment variables LOCALNET_ENABLED and OBSERVABILITY_ENABLED to true or false as desired.
The LocalNet runtime configuration is handled by docker-compose configured in compose.yaml using environment variables from .env in the quickstart/ project root directory. The usual Docker commands and tooling applies.
Immediately useful commands you probably already know:
$ docker pslists the running containers.$ docker logs [-f] <container>fetches the logs of a container, and follow the logs with the-foption.- If the system is not working well to the extent you do not trust the observability stack (discussed later),
docker logs backend-serviceis a good place to start looking for errors that might provide an insight into what has gone wrong.
- If the system is not working well to the extent you do not trust the observability stack (discussed later),
$ docker restart <container>for those instances where a container seems to have become stuck.
Observability overview
The Quickstart application provides a foundational production Daml application. It includes a full observability configuration which is helpful to troubleshoot or debug an application. As a working demo, Quickstart is opinionated regarding its technology stack. However, the platform itself is agnostic. Individual components can be replaced as required. The current troubleshooting and debugging services include:- Local ledger inspection via Daml Shell
- Datasource collection and management via OpenTelemetry
- This uses the OTEL Collector (https://opentelemetry.io/docs/collector)
- Metrics are aggregated using Prometheus (https://prometheus.io/)
- Logs are inspected with lnav (see the lnav download and documentation page)
- Traces are aggregated using Tempo (https://grafana.com/oss/tempo/)
- Aggregated observations (metrics, logs, and traces) are viewable via Grafana (https://grafana.com/oss/grafana/) which acts to allow hyperlinked exploration of the Observability fields.
Daml Shell
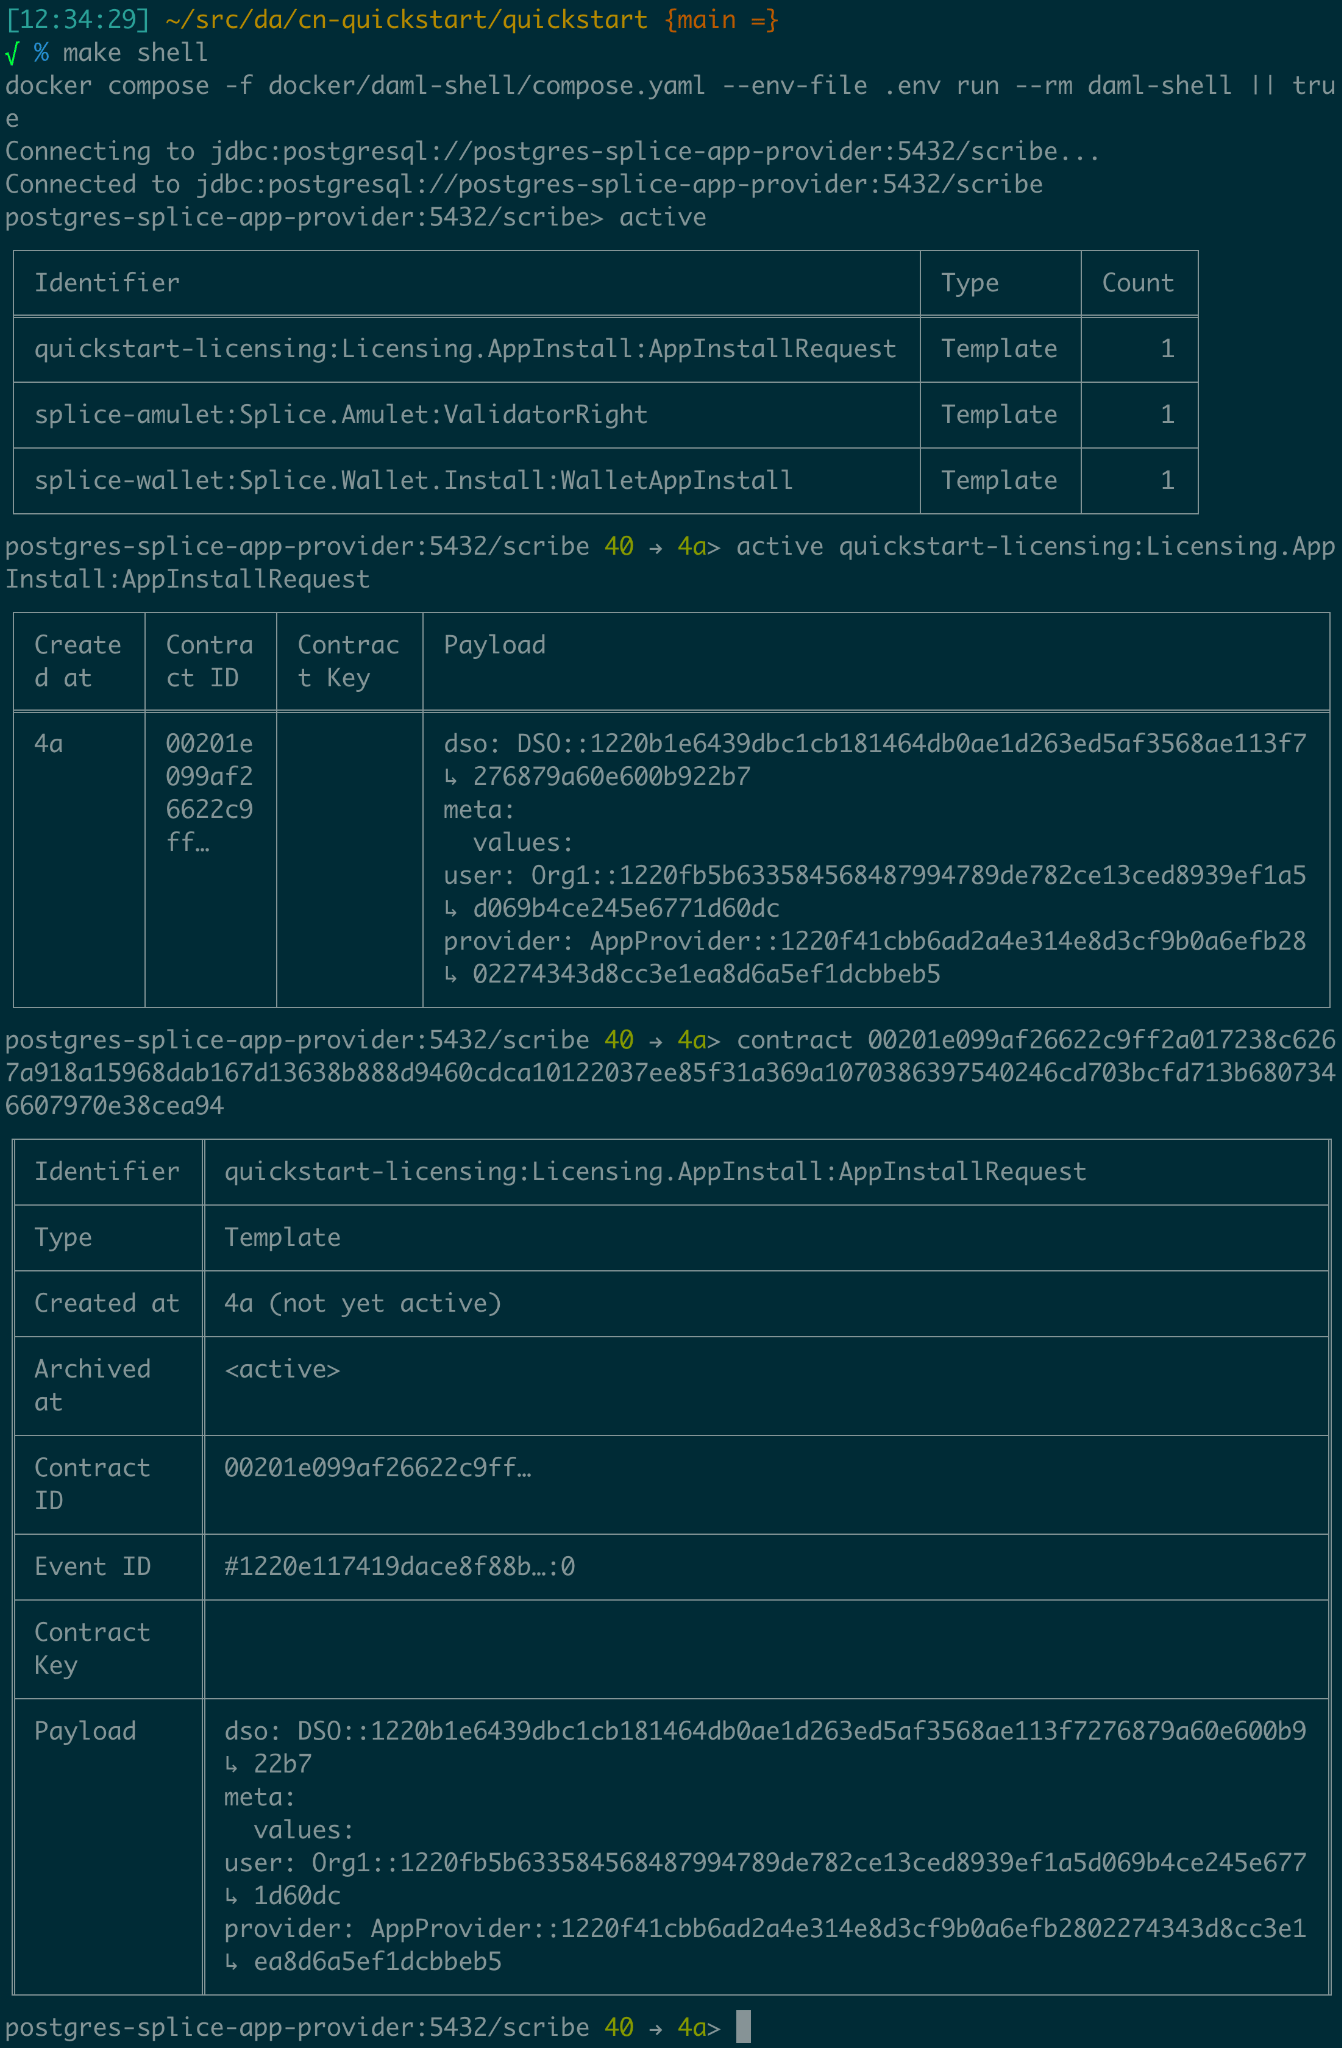
Daml Shell is a terminal application that provides interactive local ledger inspection on top of PQS. Quickstart is configured to launch Daml Shell in a Docker container and is configured to connect to the included application provider’s PQS instance. This is easiest to access via the top-level project scripts accessed viamake from quickstart/. To see this in action, build and start the quickstart app then:
Run $ make create-app-install-request to use curl to submit the create AppInstallRequest ... command to the ledger1 to initiate user onboarding2. Then you can use the following Daml Shell commands:
> active to see a summary of the contracts you created; and,
> active quickstart-licensing:Licensing.AppInstall:AppInstallRequest to see the contract details for any Asset contracts on the ledger; finally,
> contract [contract-id from the previous command]3 to see the full detail of the AppInstallRequest contract on the ledger.
> help [command] provides context help for daml shell commands.4
Grafana
Grafana is accessible via its web interface, which is port-mapped to http://localhost:3030/, and can be opened in the current browser from the command line usingmake open-observe.
Your debugging should focus on using Grafana’s trace and log facilities, as well as ledger inspection via Daml Shell. If you make sure that your exported logs and traces are sufficient to support debugging during development, they are more likely to support diagnostics in production, as well.
There is additional access configured into the Quickstart that can assist with debugging on LocalNet. Use the same diagnostic tools for development as you will for production. If you add a log line that allows you to identify and fix a bug in development, then keeping it around at trace or debug log levels increases your operational readiness. Using tools that won’t be available in production to debug in development reduces operational readiness.
Direct Postgres access
All persistent state in the example application is stored in one or more postgres databases. You can use the postgres configuration in.env to connect directly to these instances.
postgres-splice-app-provider container (default username cnadmin, dbname scribe, and password supersafe; then you can use the SQL interface to PQS to examine the app-provider’s participant’s local ledger. The SQL API to PQS is documented in the daml documentation.
Interactive debugger
If you review thecompose.yaml file and examine the configuration for backend-service you will see the lines:
Observability and tracing
Faulty distributed systems can be notoriously hard to diagnose. From the start of a project, Quickstart provides the sort of observability and diagnostics facilities that are otherwise often only developed toward the end. Simplifying diagnostics for new Canton Network Applications from the outset of each project is one of the motivations behind the development of Quickstart. The links in the overview include the official user and reference documentation for the various tools included in Quickstart. While there is no substitute for the official documentation, it is hoped the following tour of the capabilities configured into Quickstart can provide a starting point for your own experimentation.Correlation identifiers
Inspecting Canton begins by correlating identifiers, much like inspecting any other distributed system. Canton can accept and/or generate a number of identifiers suitable for correlating across both time, various nodes, and the evolving state of the ledger. A few of the key identifiers to be aware of are:
Useful Correlation Identifiers
The goal of the observability configuration is to make it easier to navigate through the provenance of any state or event in the wider system. Any or all of these identifiers can be used to correlate a combination of logs, metrics, and state. Three of these in particular are intended to be set to corresponding business identifiers derived from your specific business domain: application-id, workflow-id, and command-id.
Navigation is enabled by the use of structured logs from as many components as possible9. It is recommended that your custom components likewise emit structured logs for more accurate consumption by OpenTelemetery.
Direct Ledger inspection using correlation identifiers
Starting from$ make stop clean-all && make build start, we proceed with initiating the example application app-user onboarding:
We can immediately use the transaction id in Daml Shell to view the associated ledger transaction:
The Workflow Id, Template Id, and Party Ids are also visible here. The ledger offset can be very useful if you are going to query PQS or the Ledger API directly for more information. The Contract Id can be used to immediately display the contract in Daml Shell:
Correlated Logs and Traces using Correlation Identifiers
To advance the example, we log in as the AppProvider and accept the AppInstallRequest, resulting in:
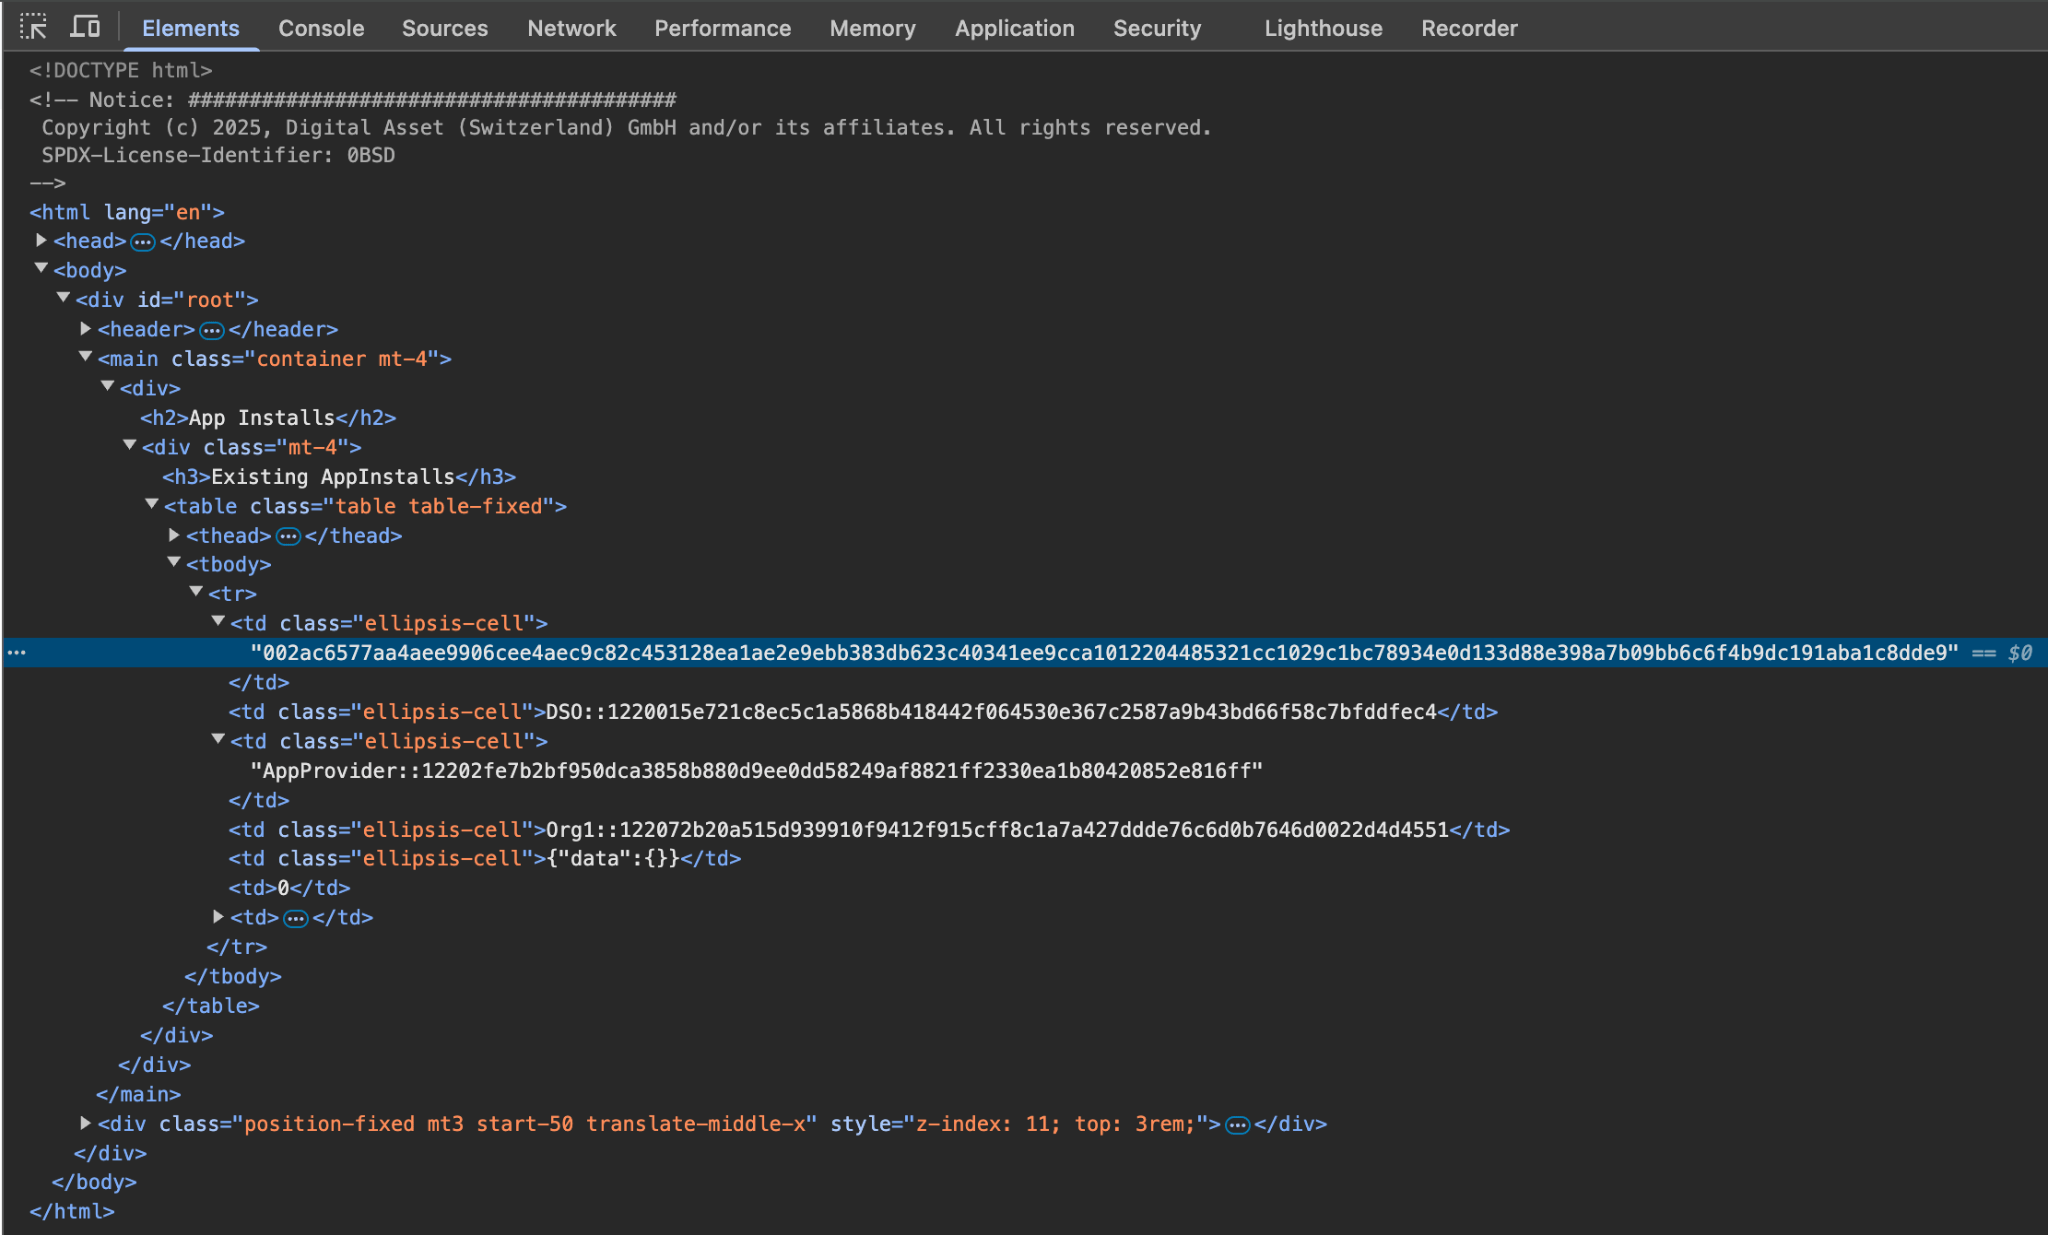
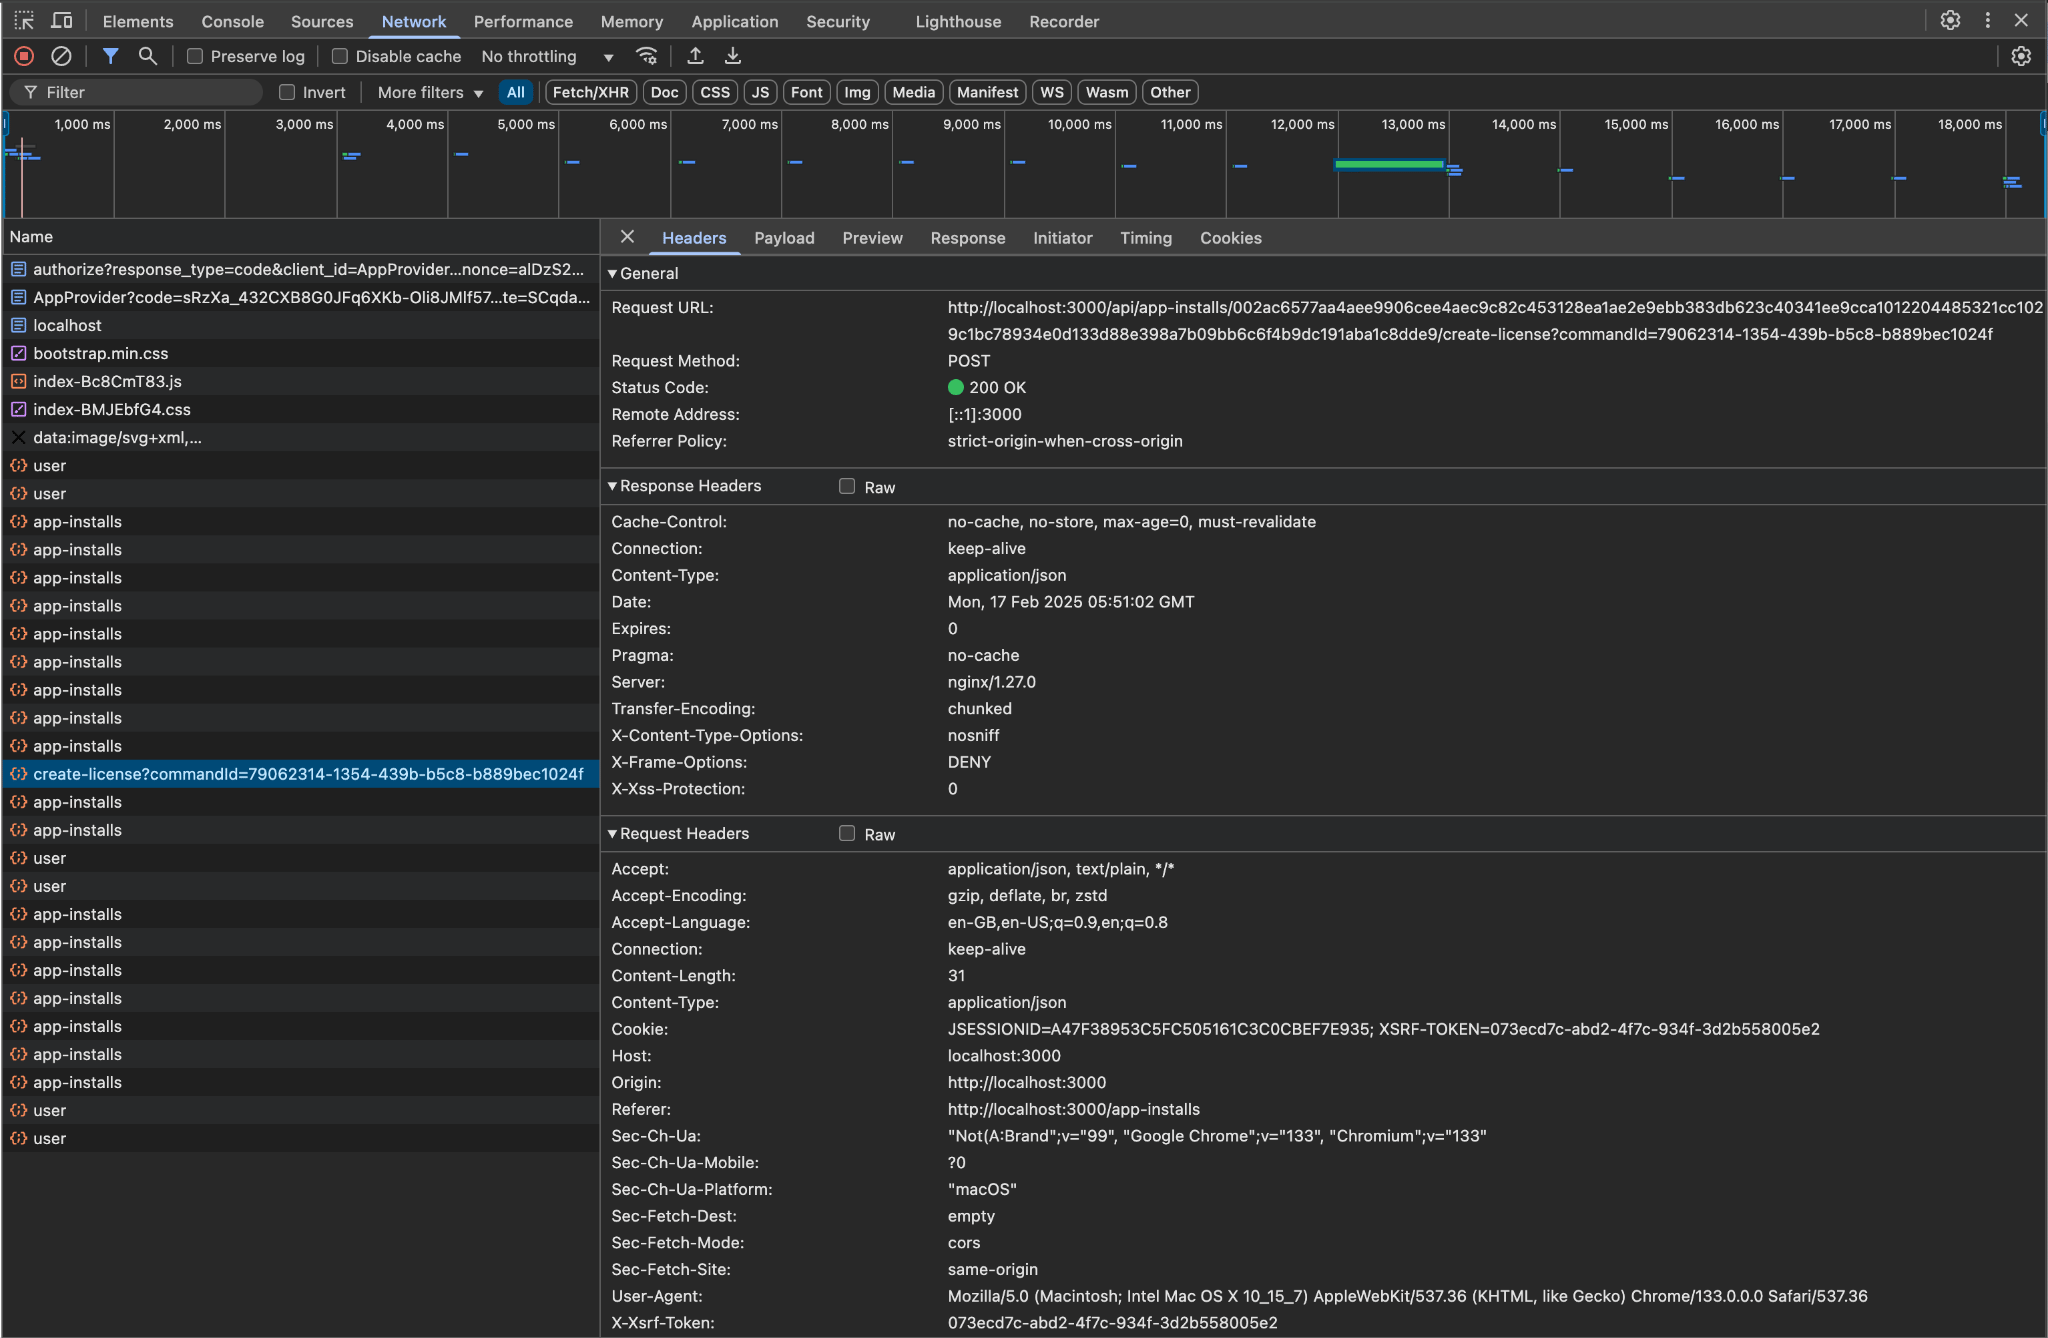


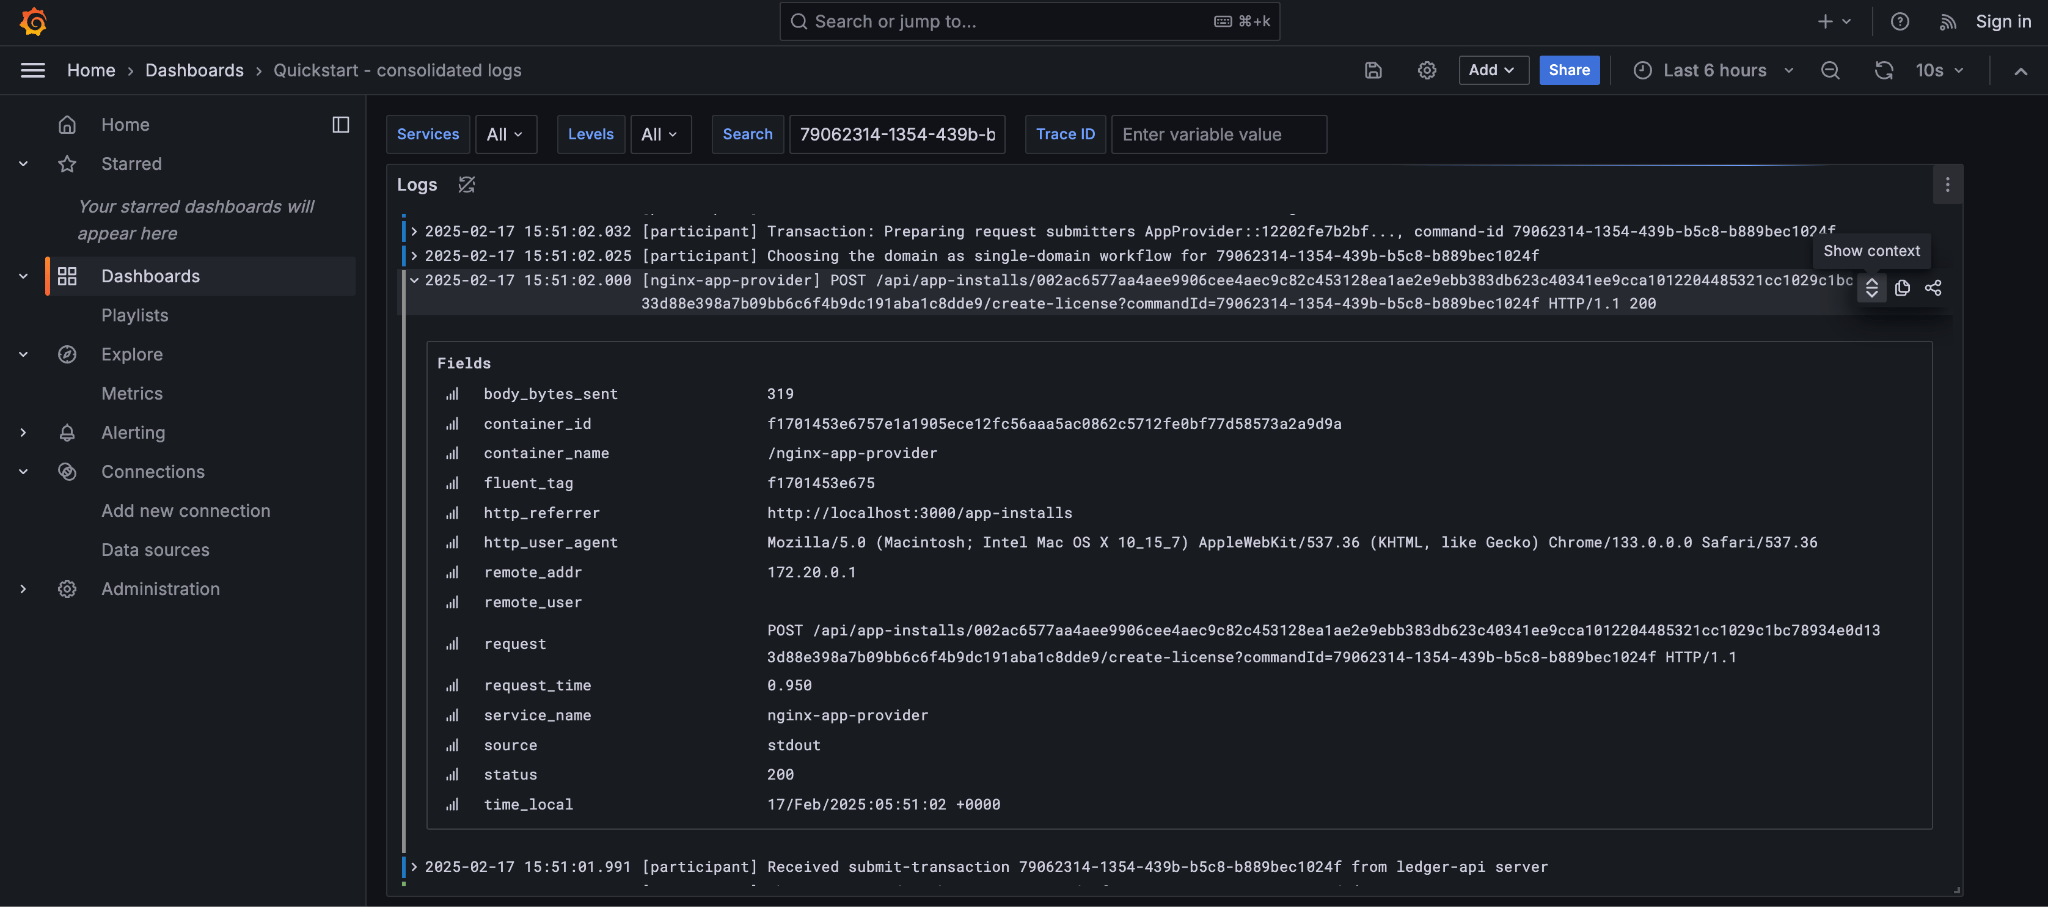
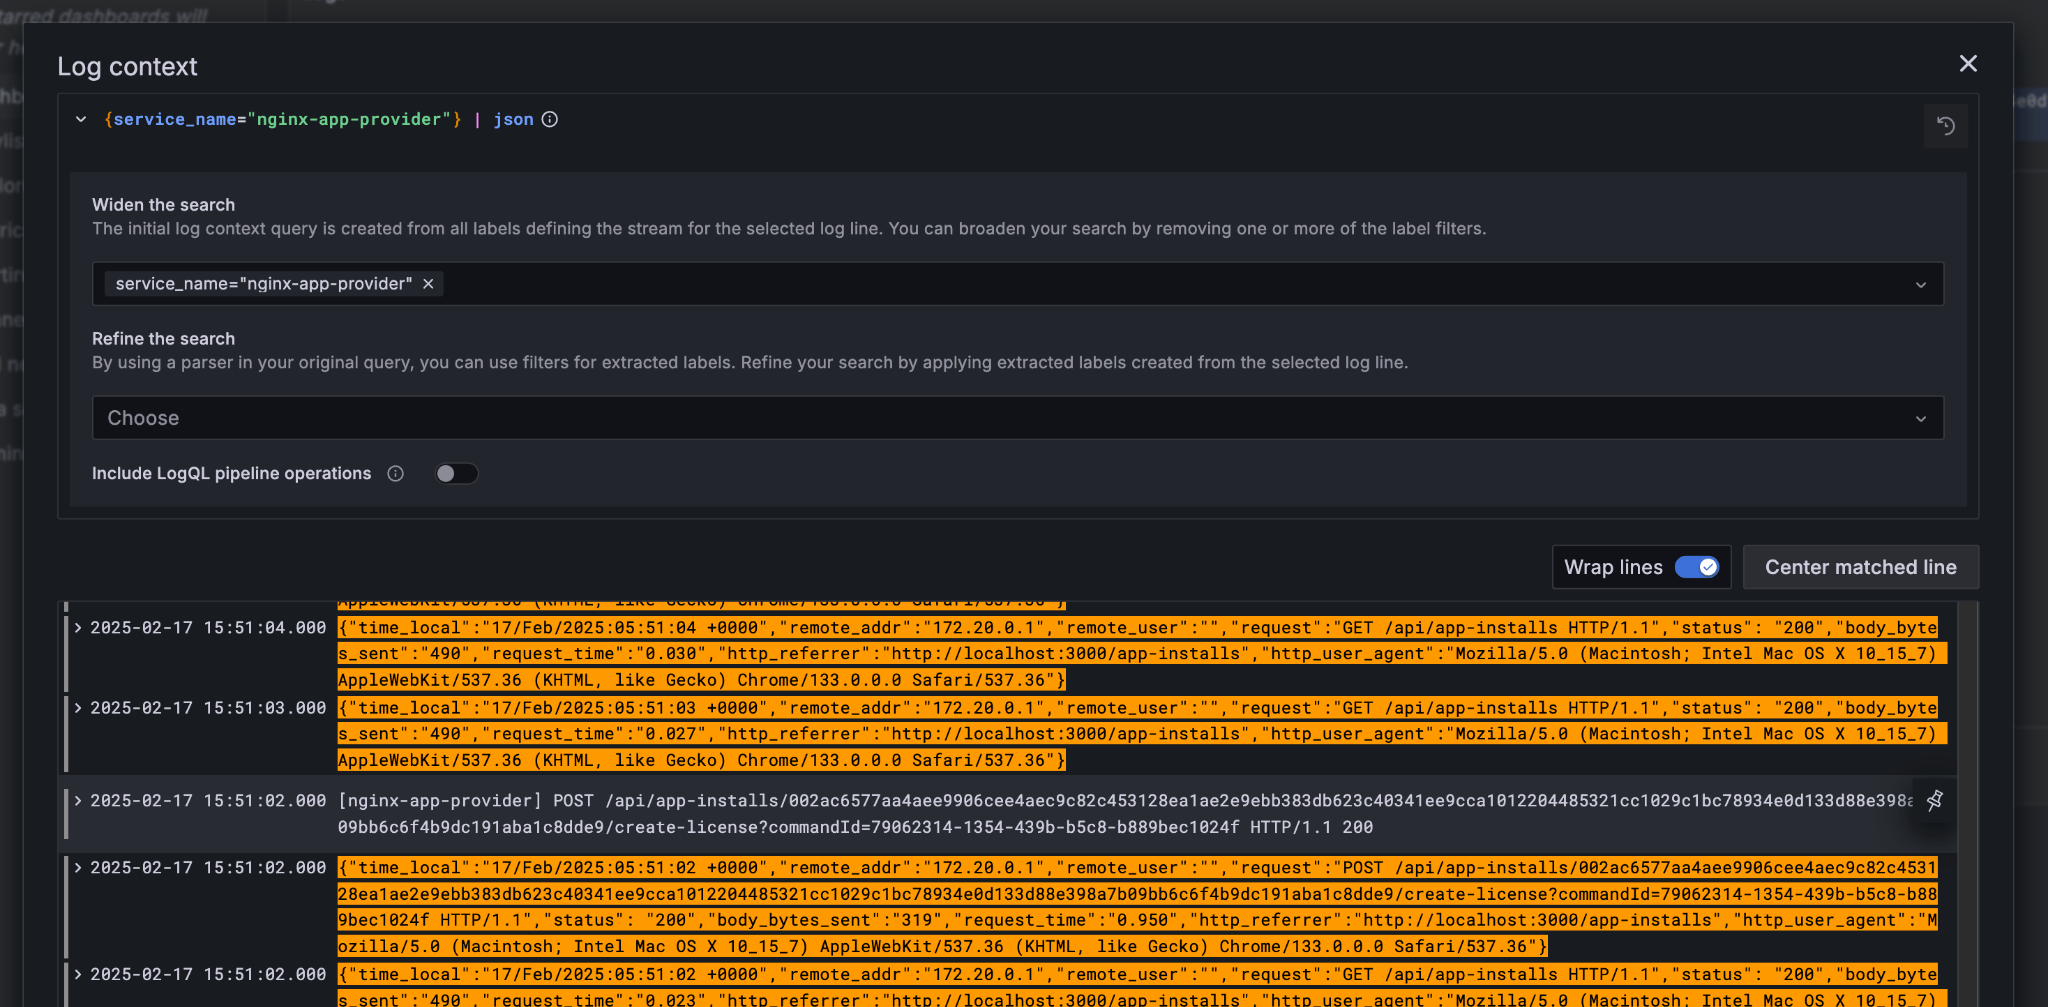
As we have already seen, contract ids can be used in Daml Shell to inspect the contracts directly. In addition, due to the way the OpenAPI interface for the Backend has been designed, the Command Id is visible as a query parameter to the POST. We can use this to query the consolidated logs in Grafana:
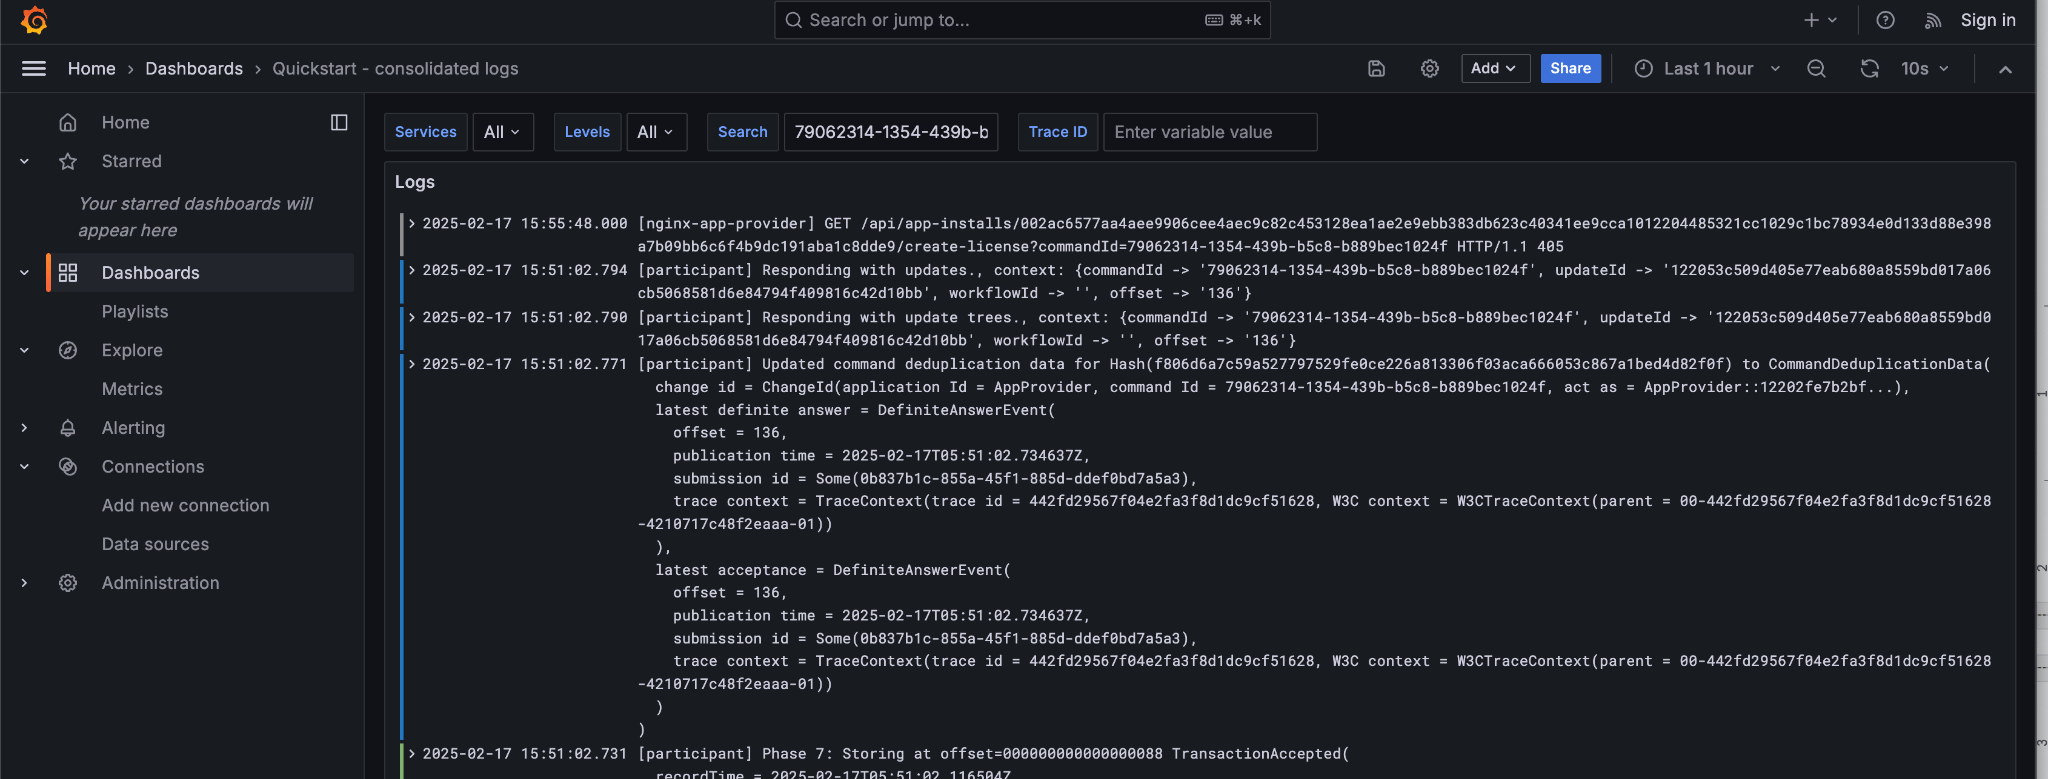
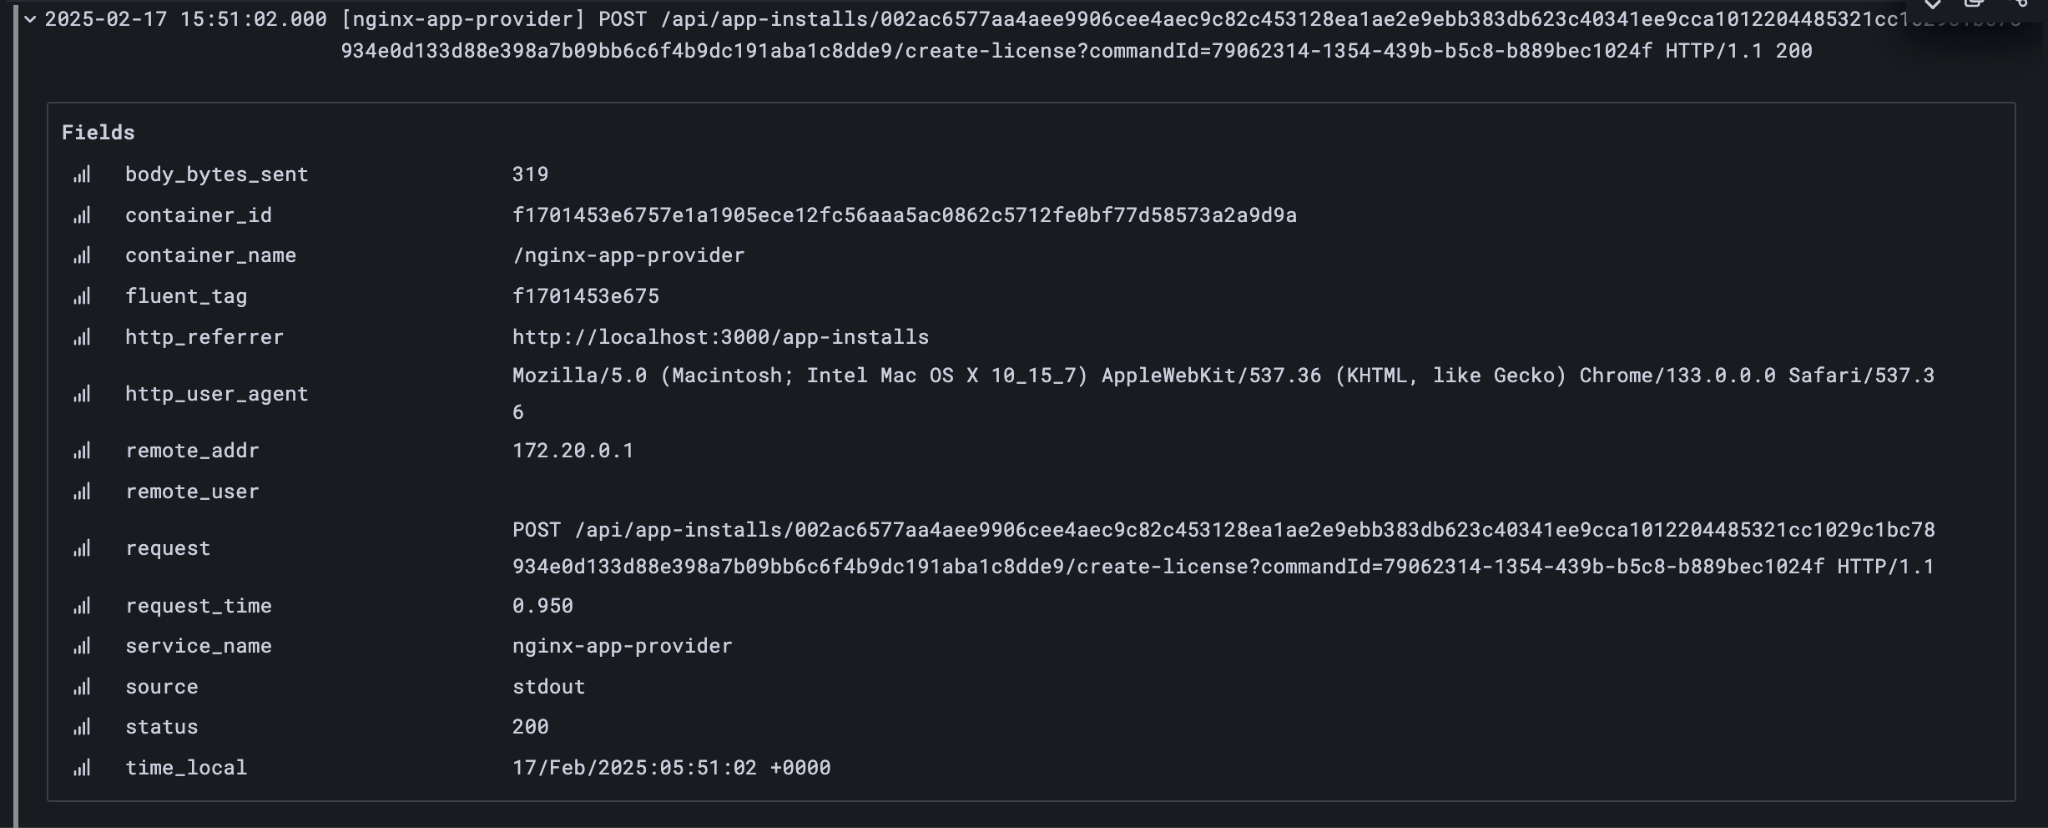
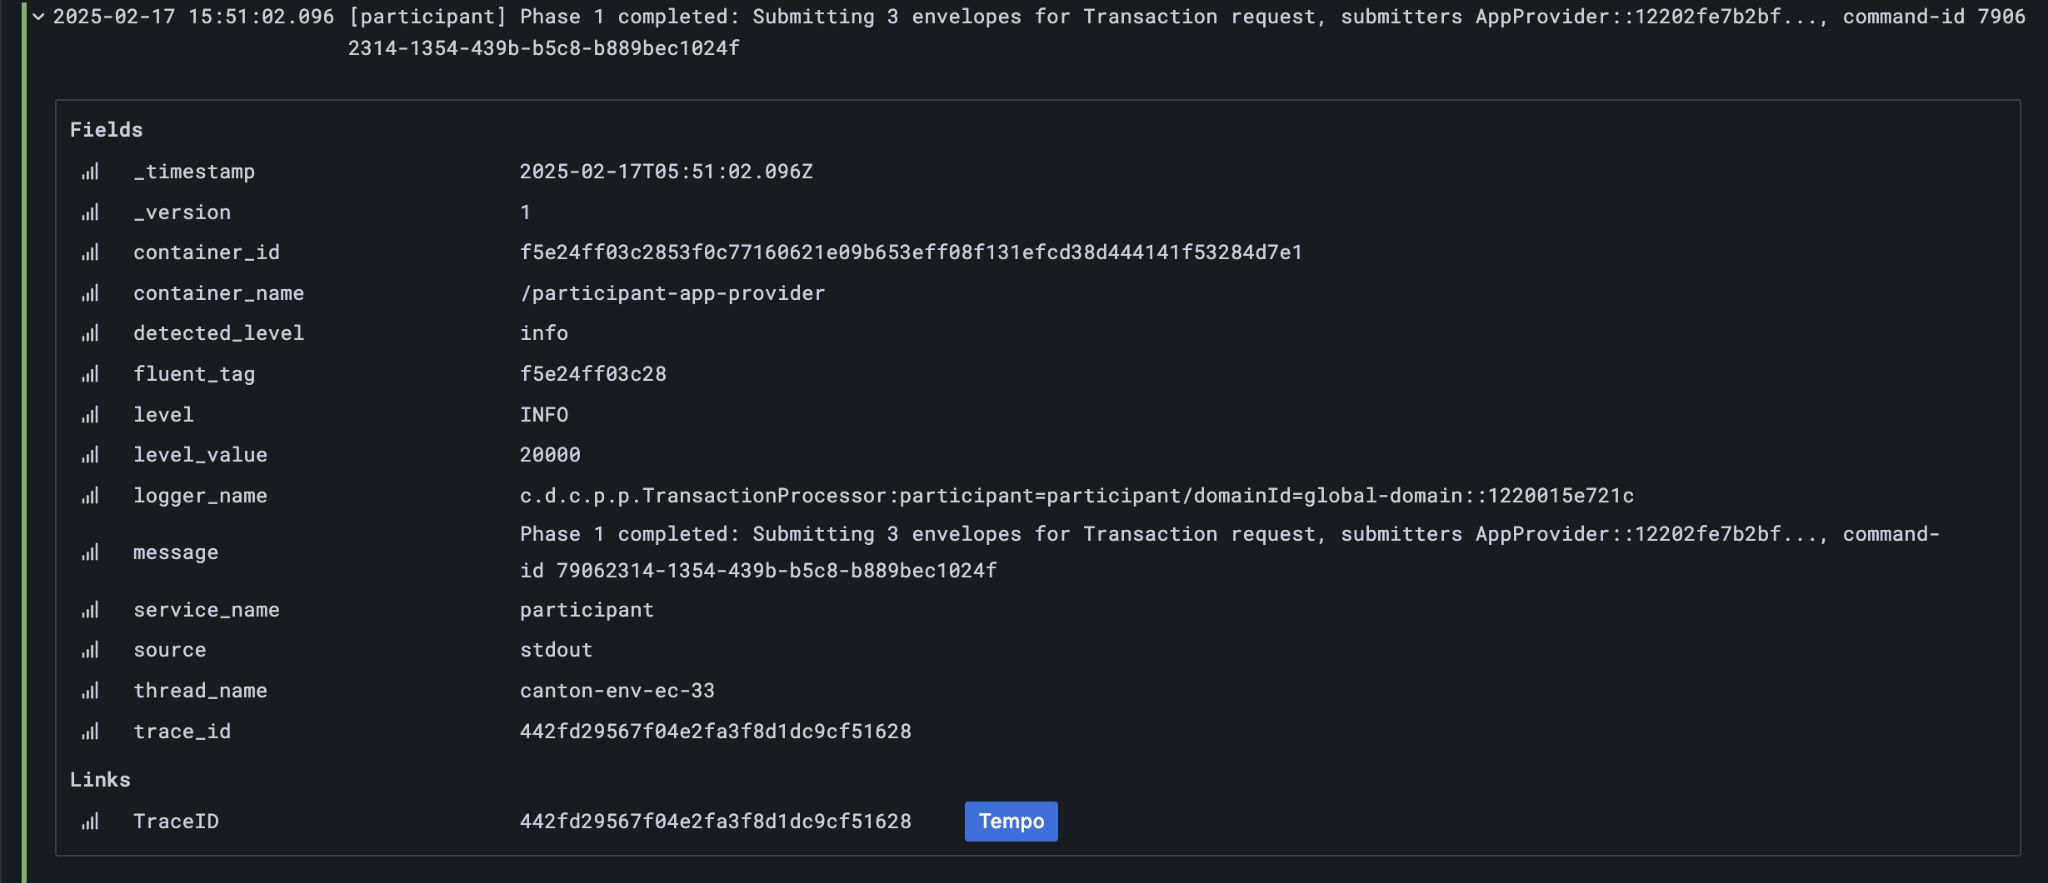
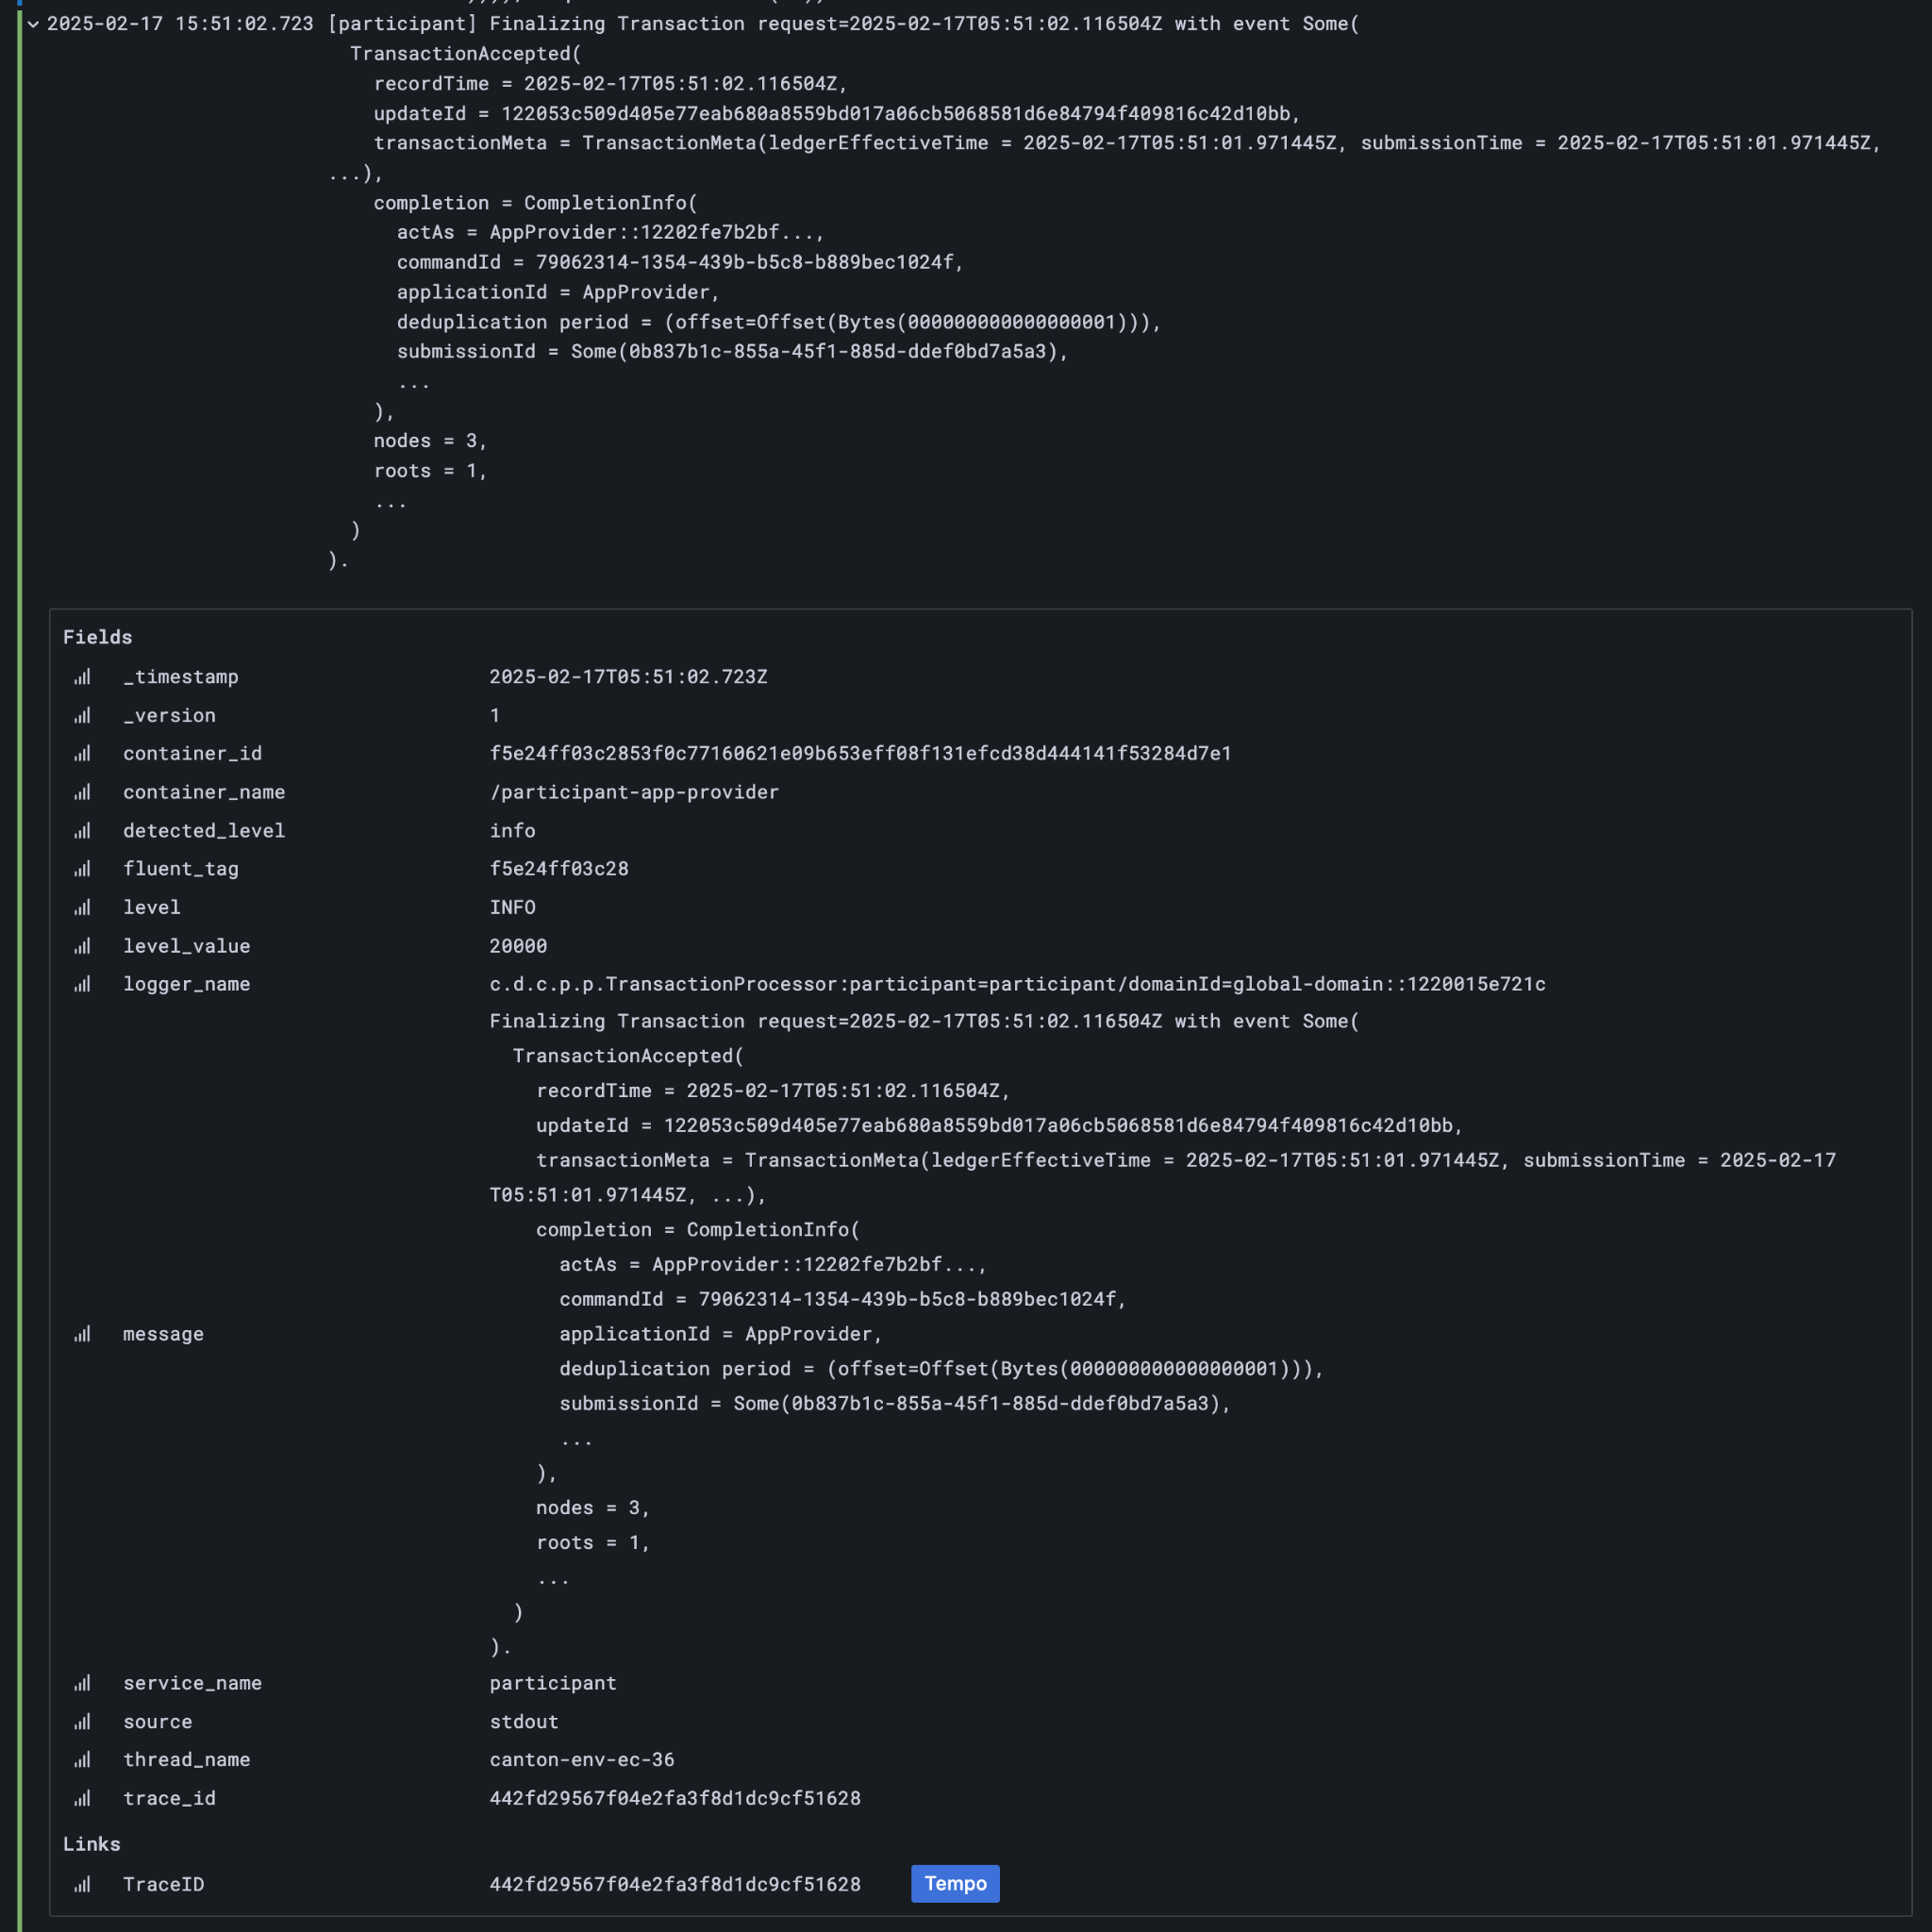
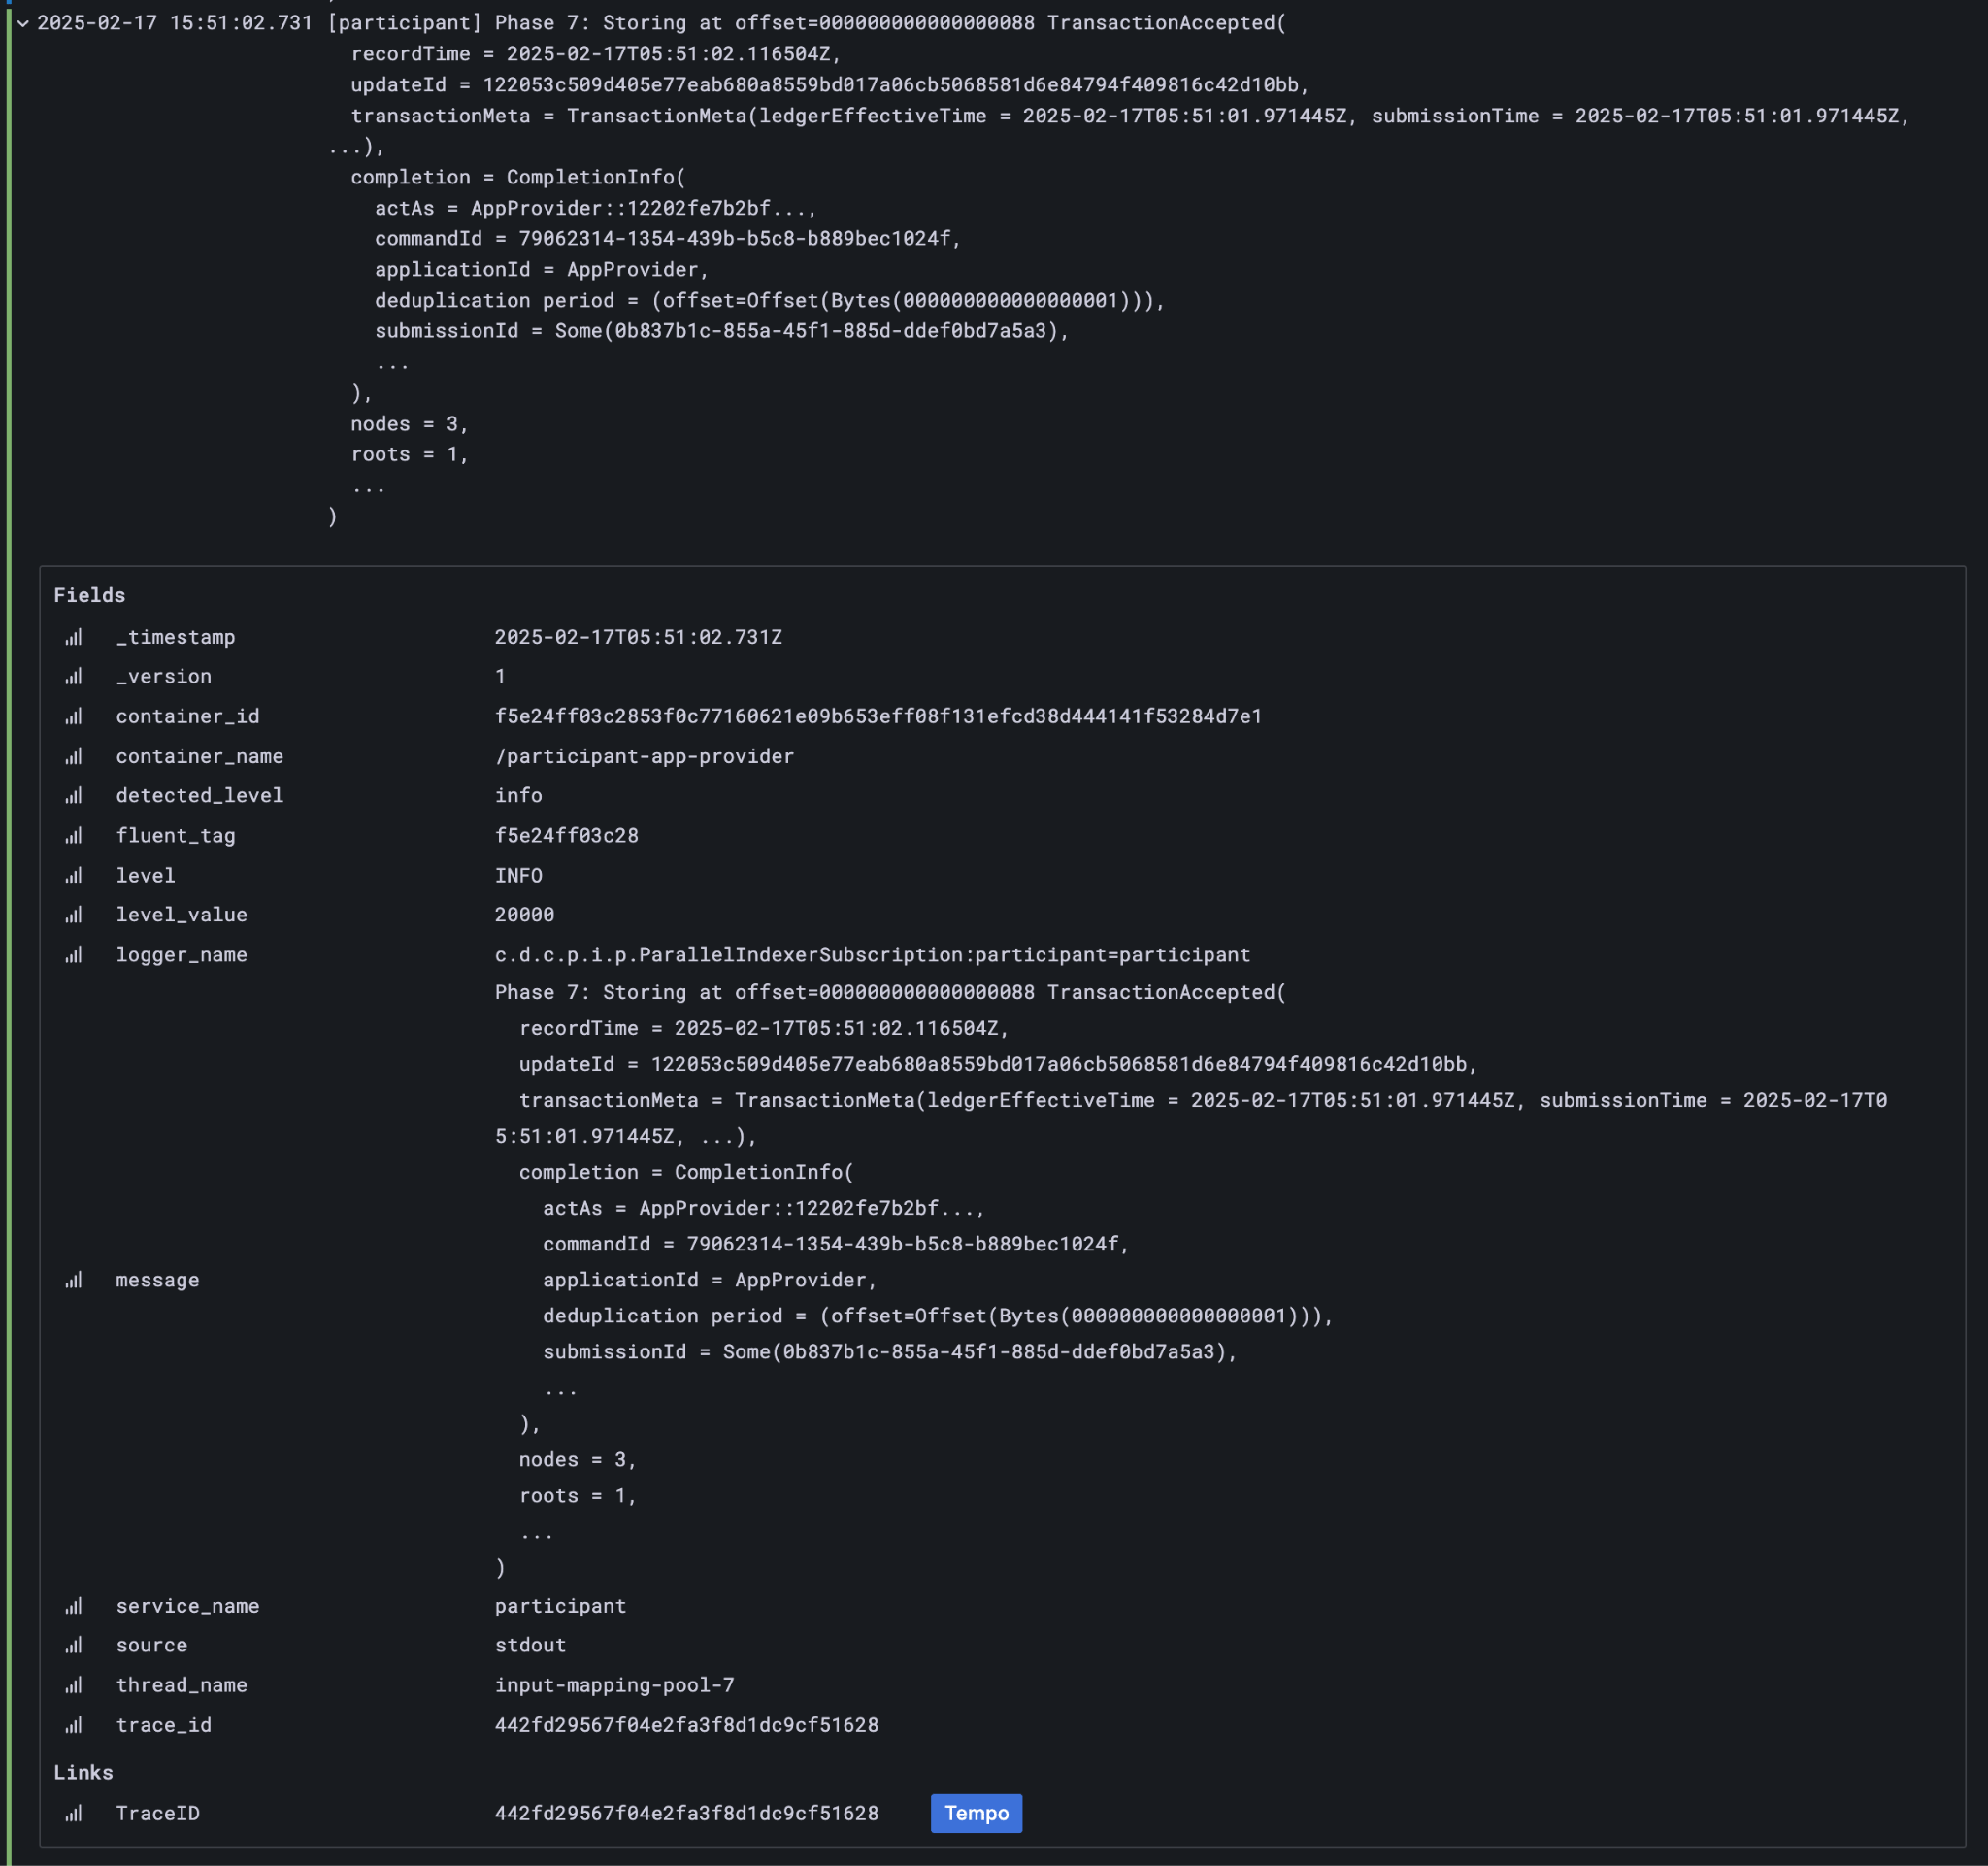
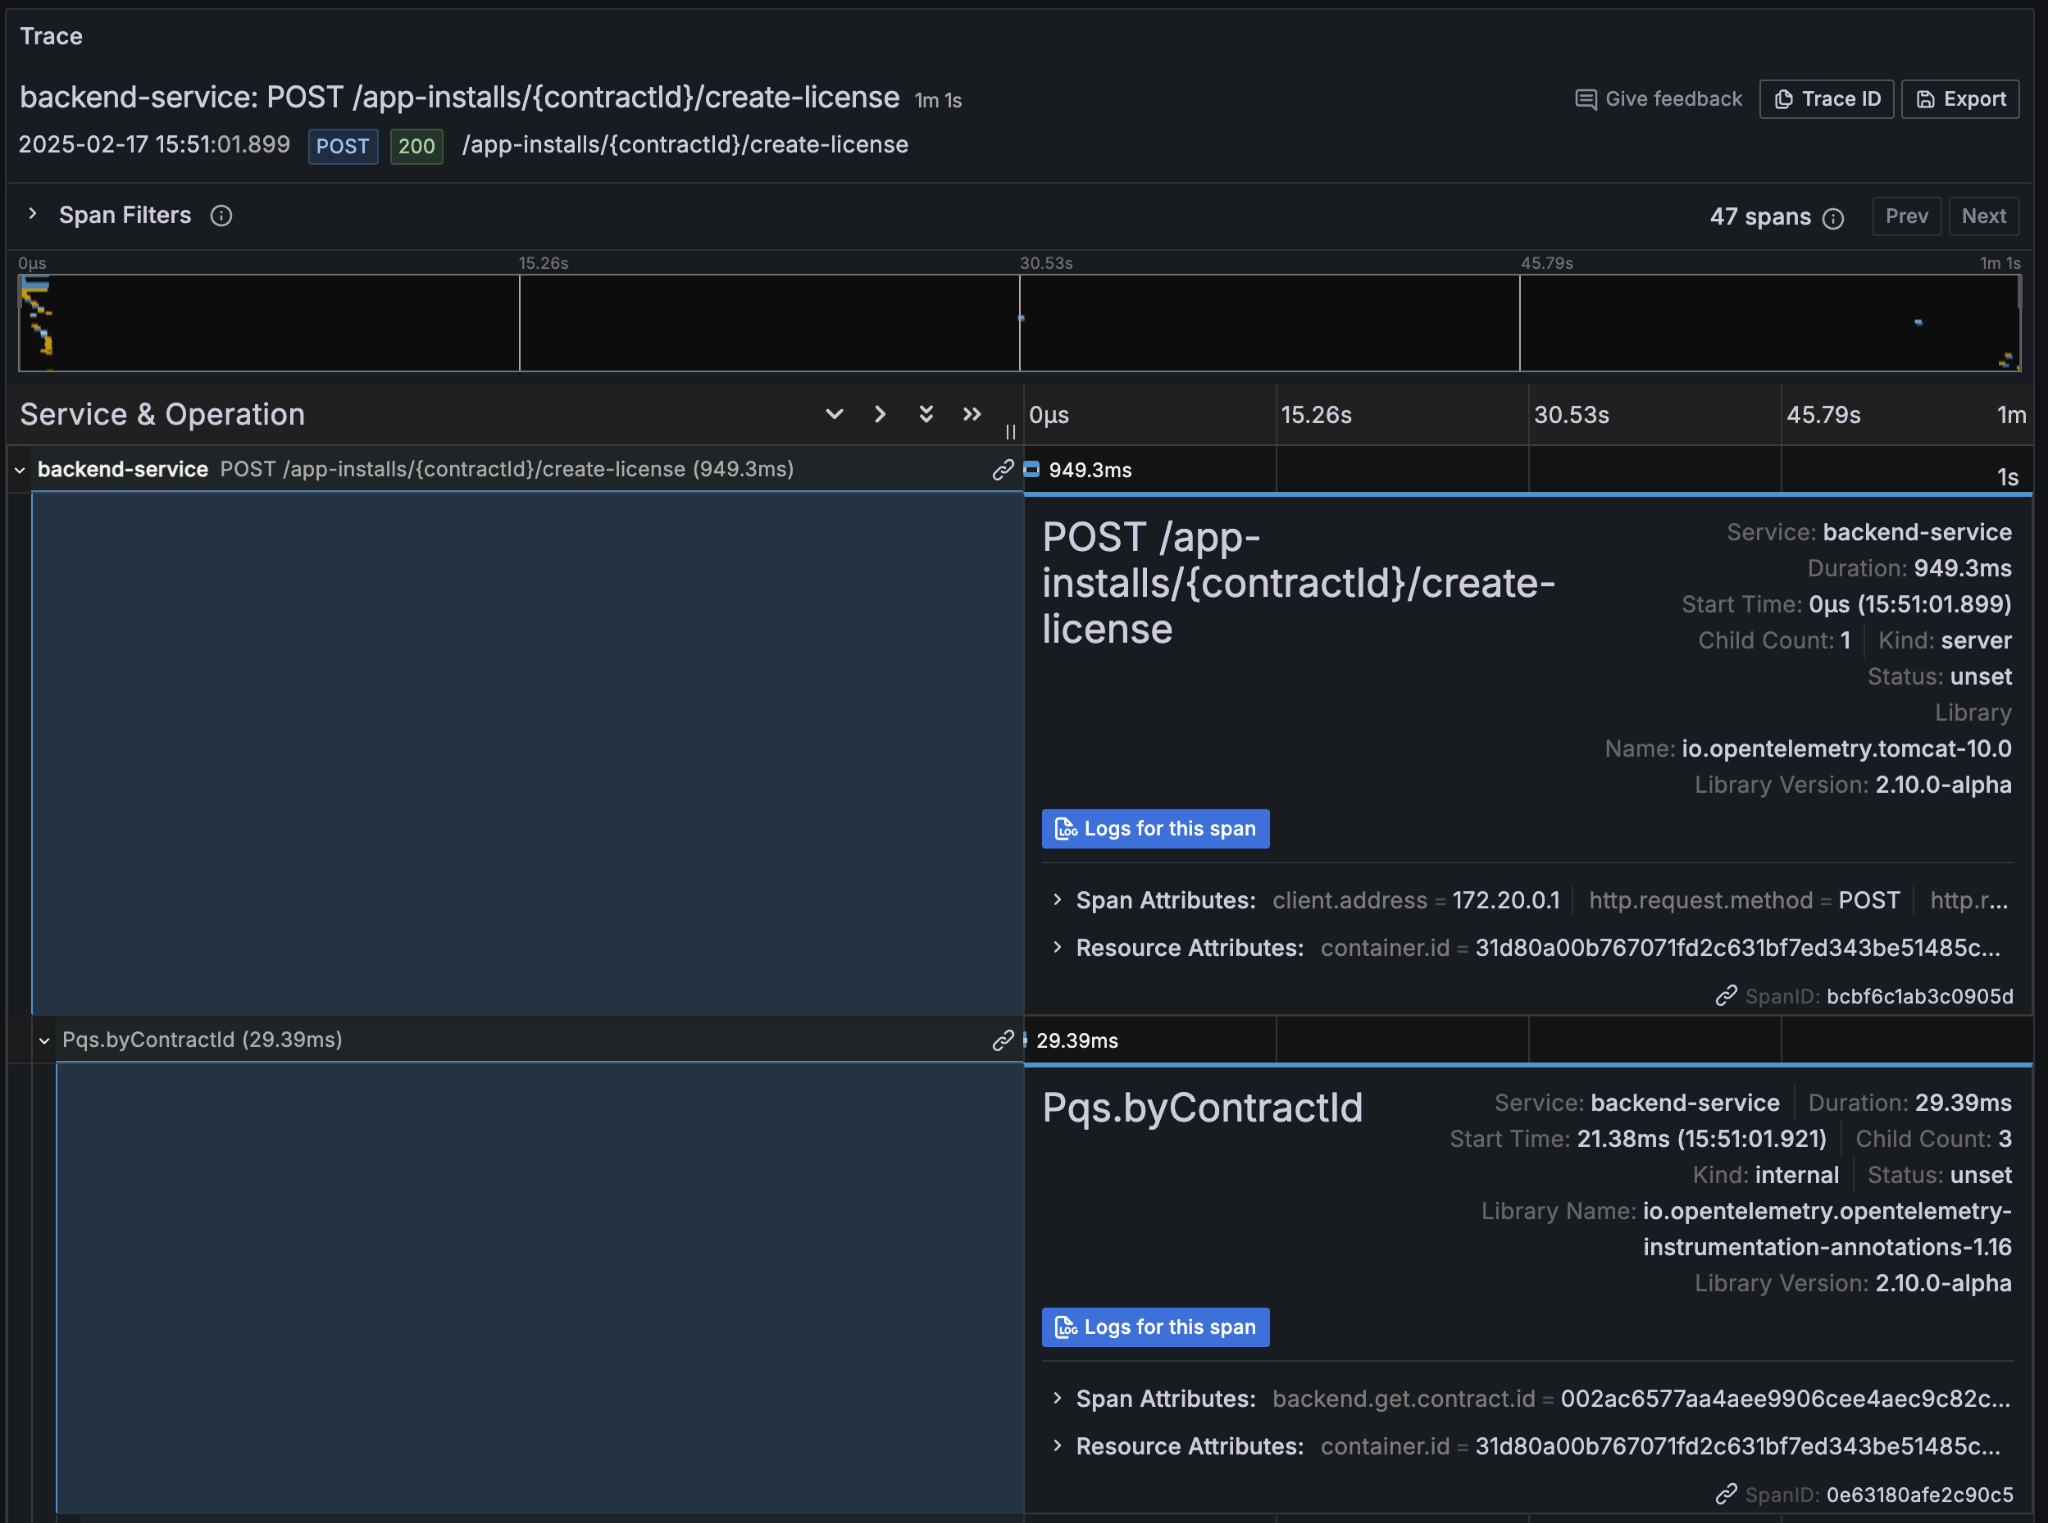
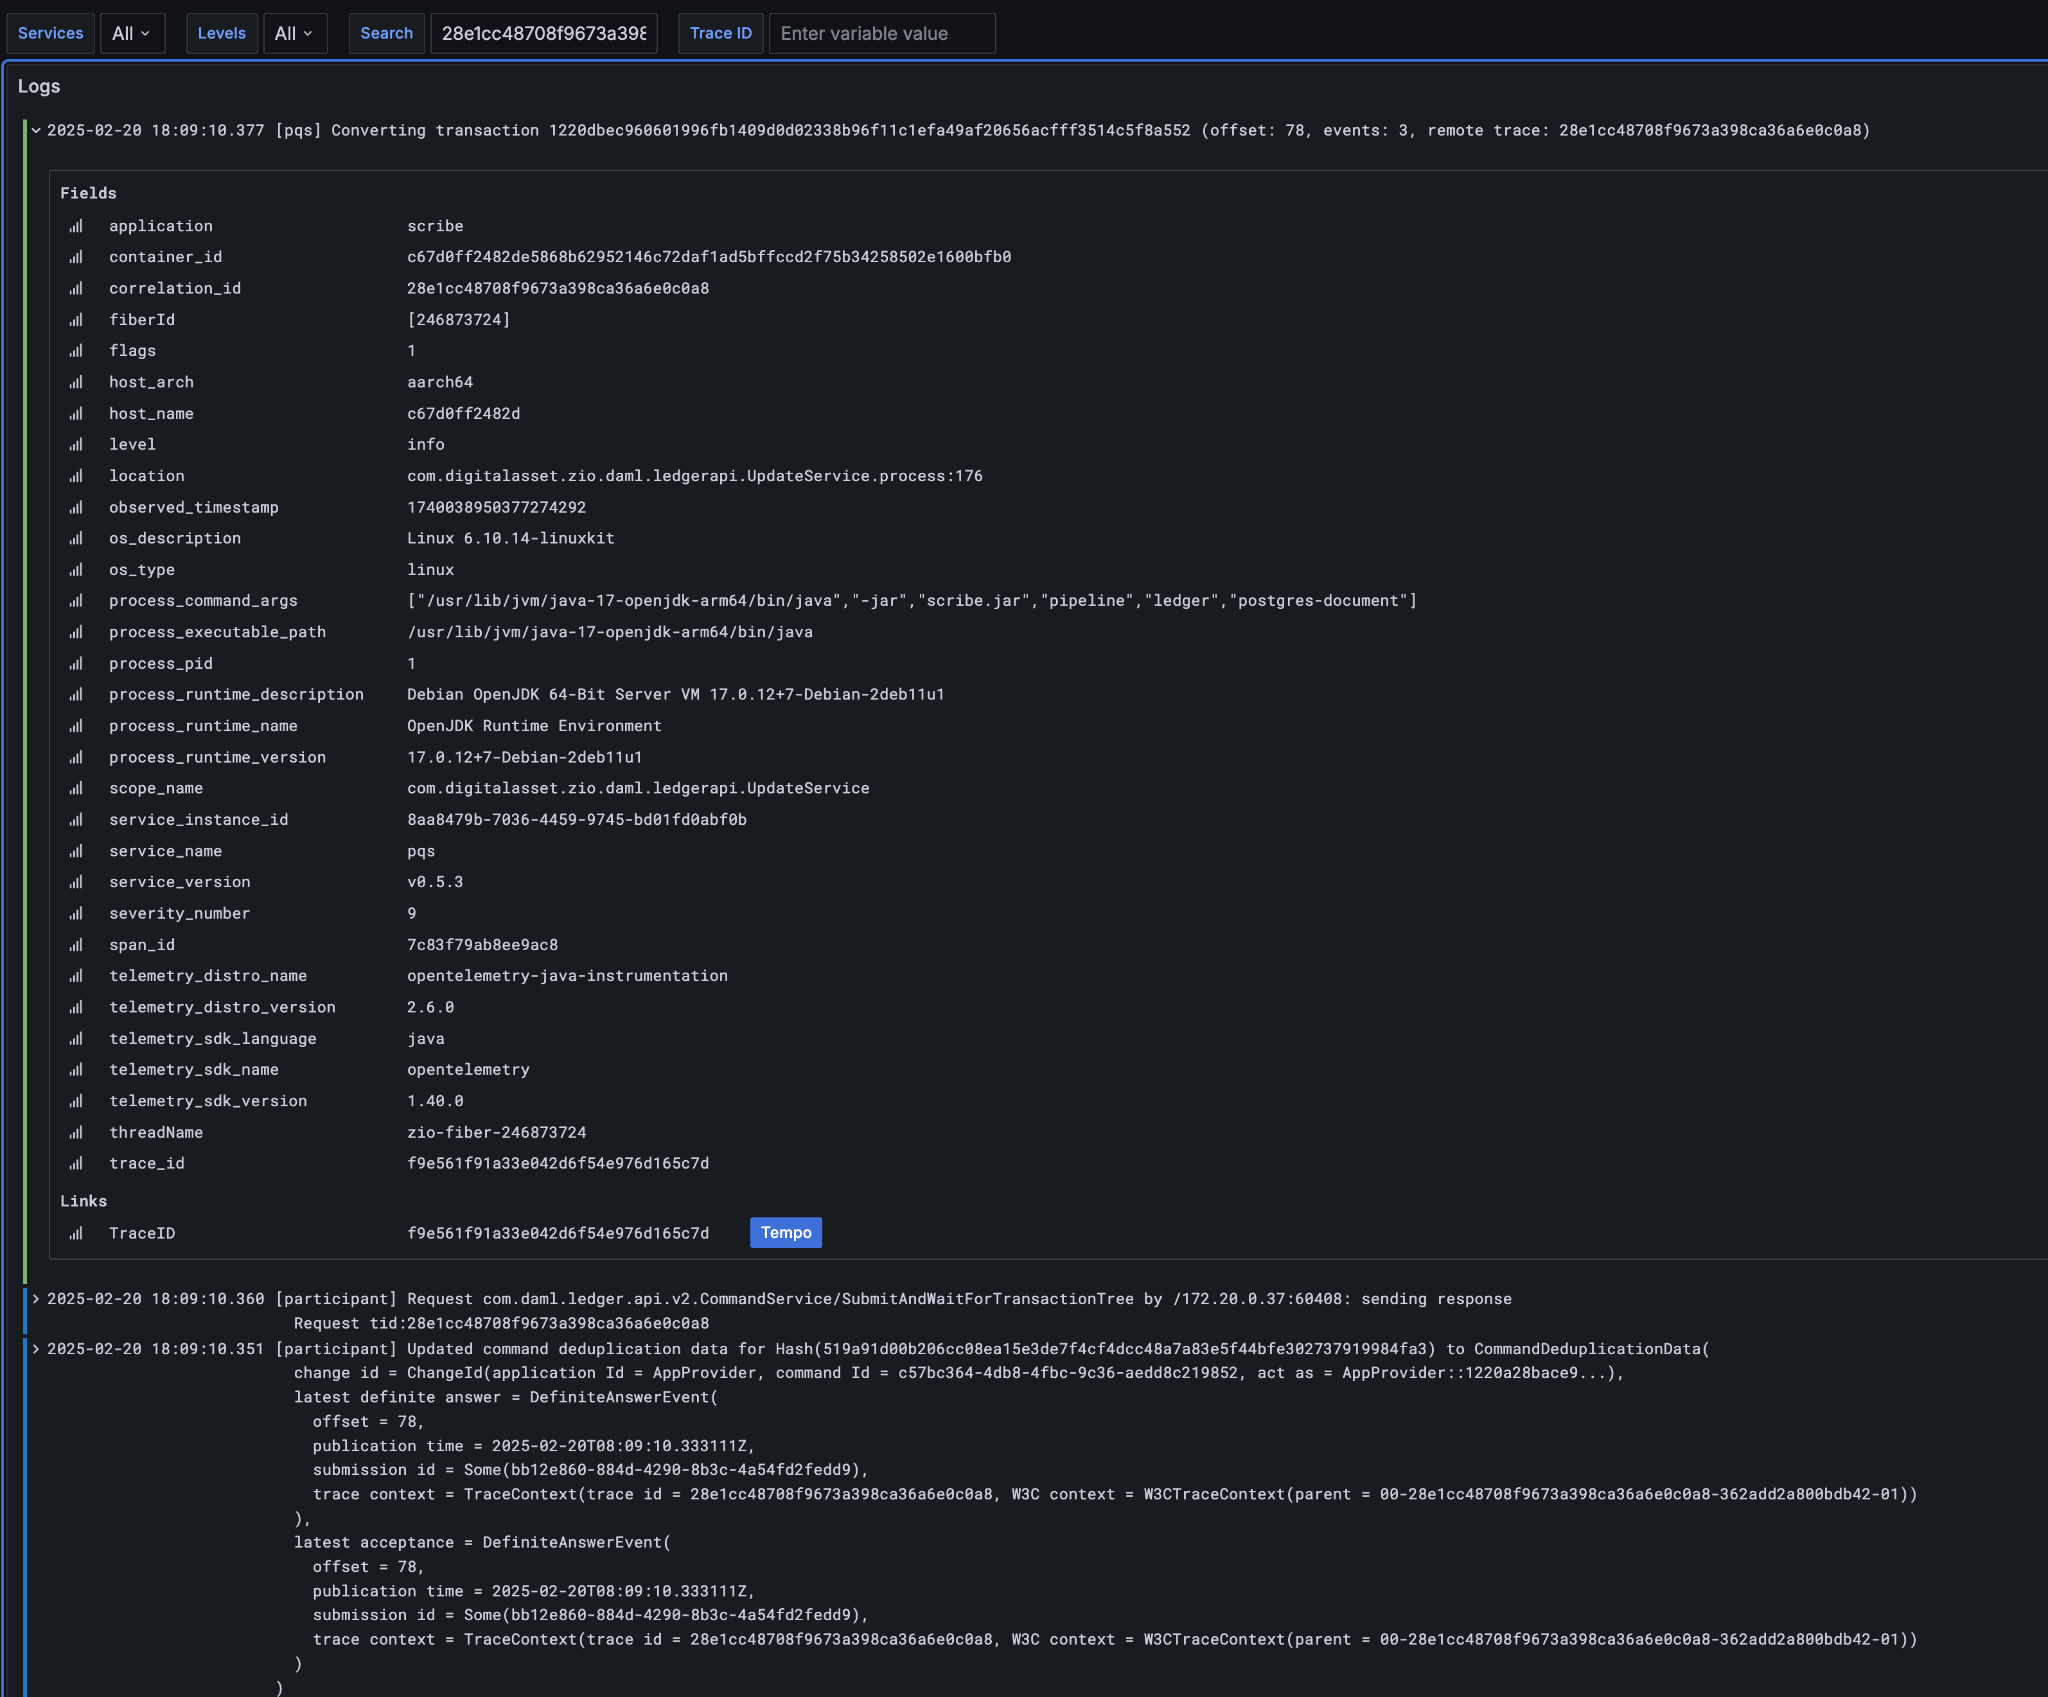
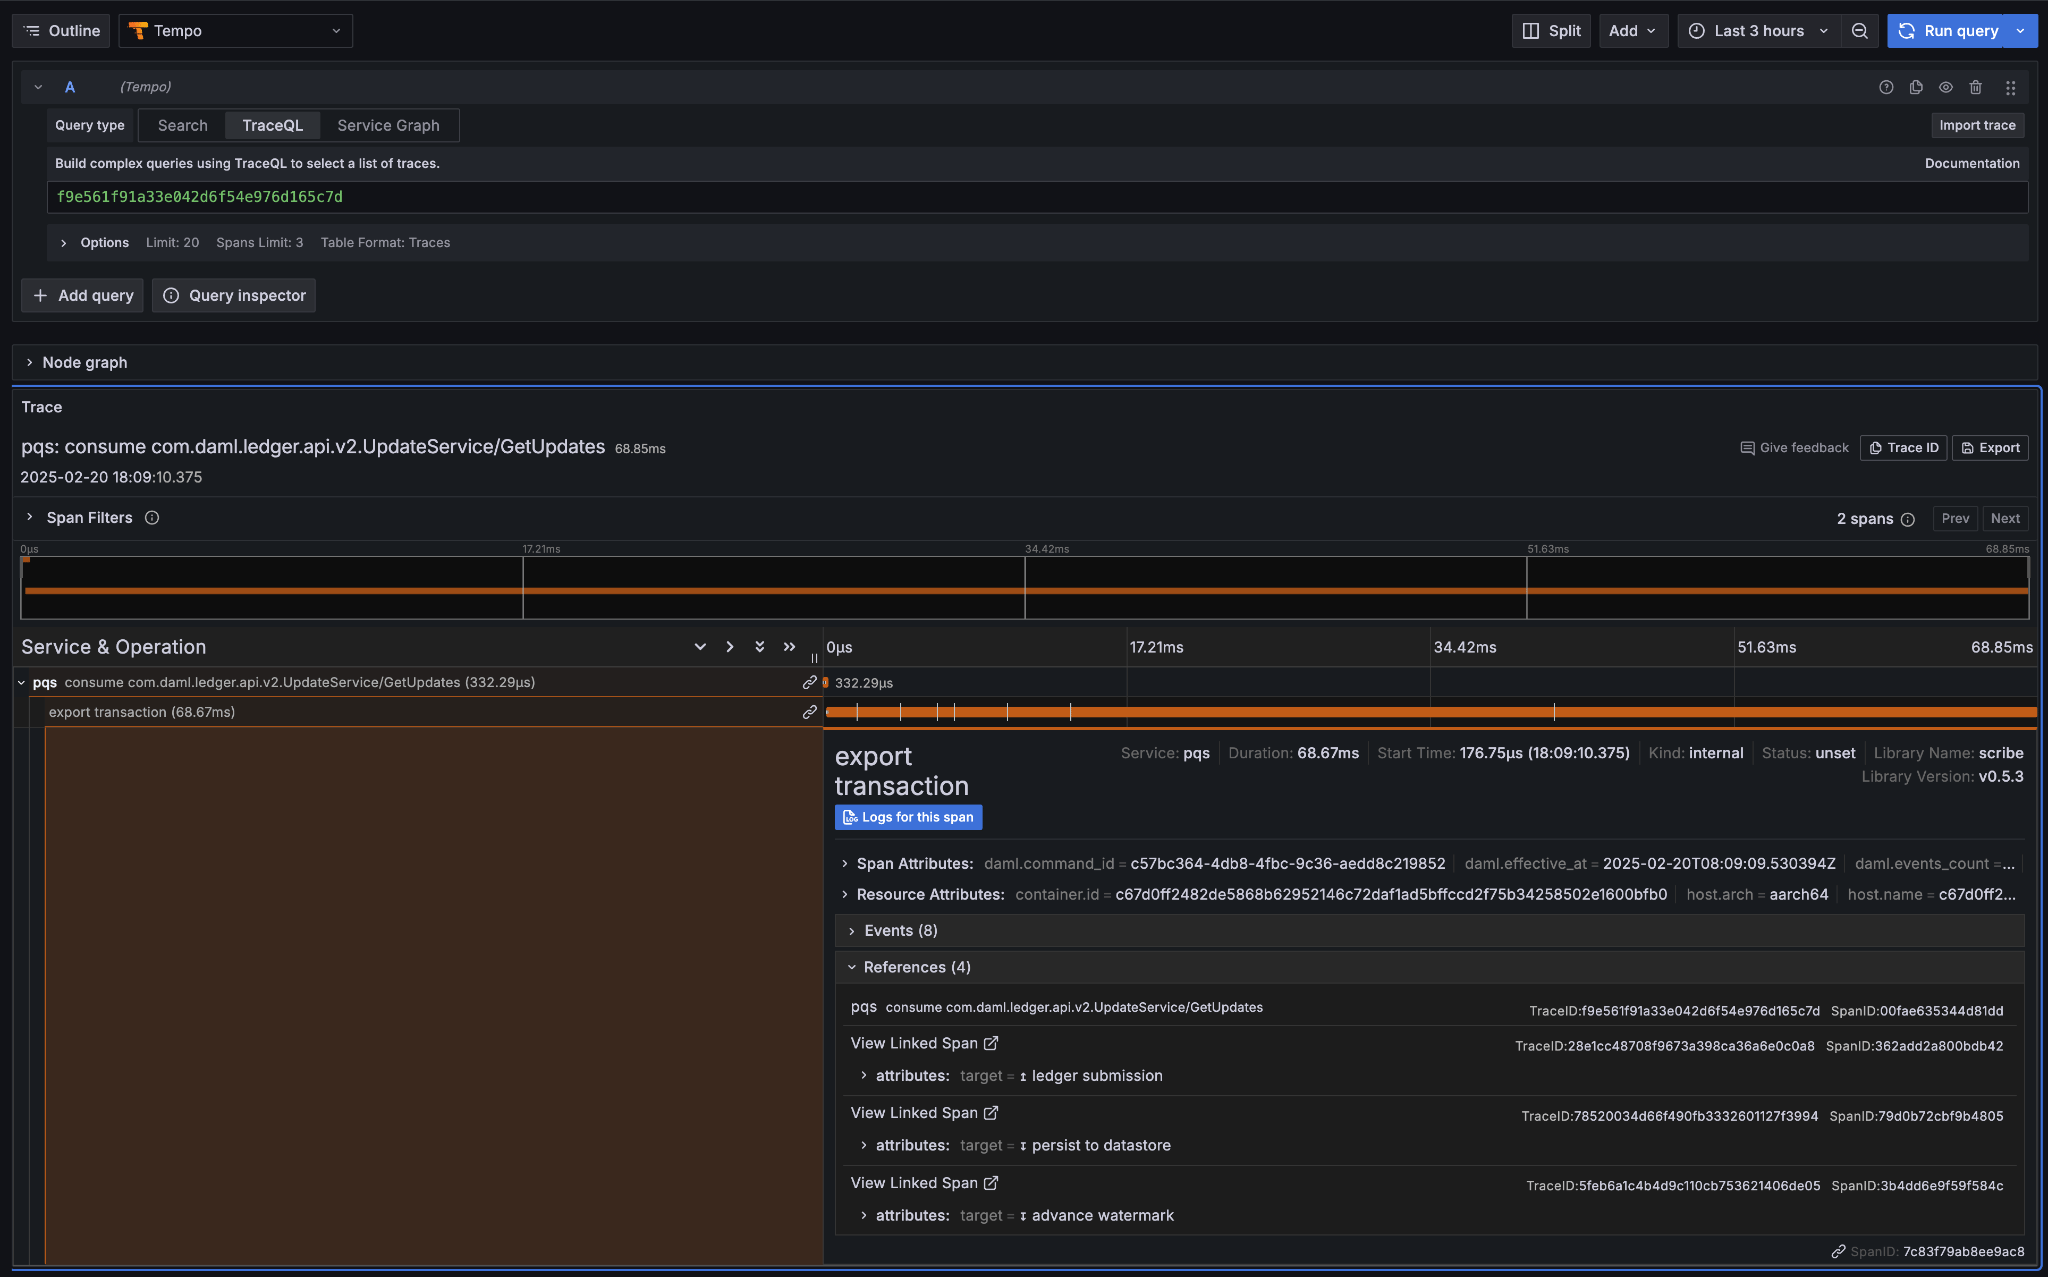
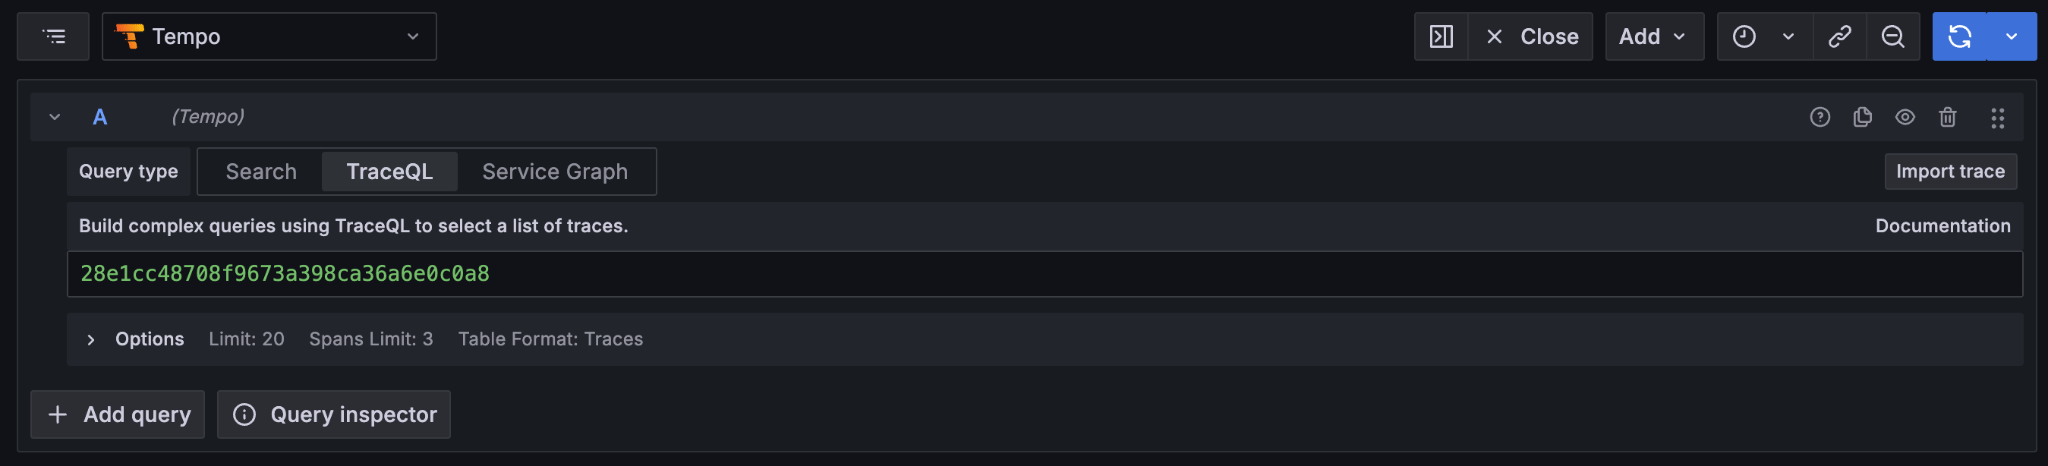
In particular the Trace Id is invaluable because it can link us directly into Tempo to see the distributed operation spans:
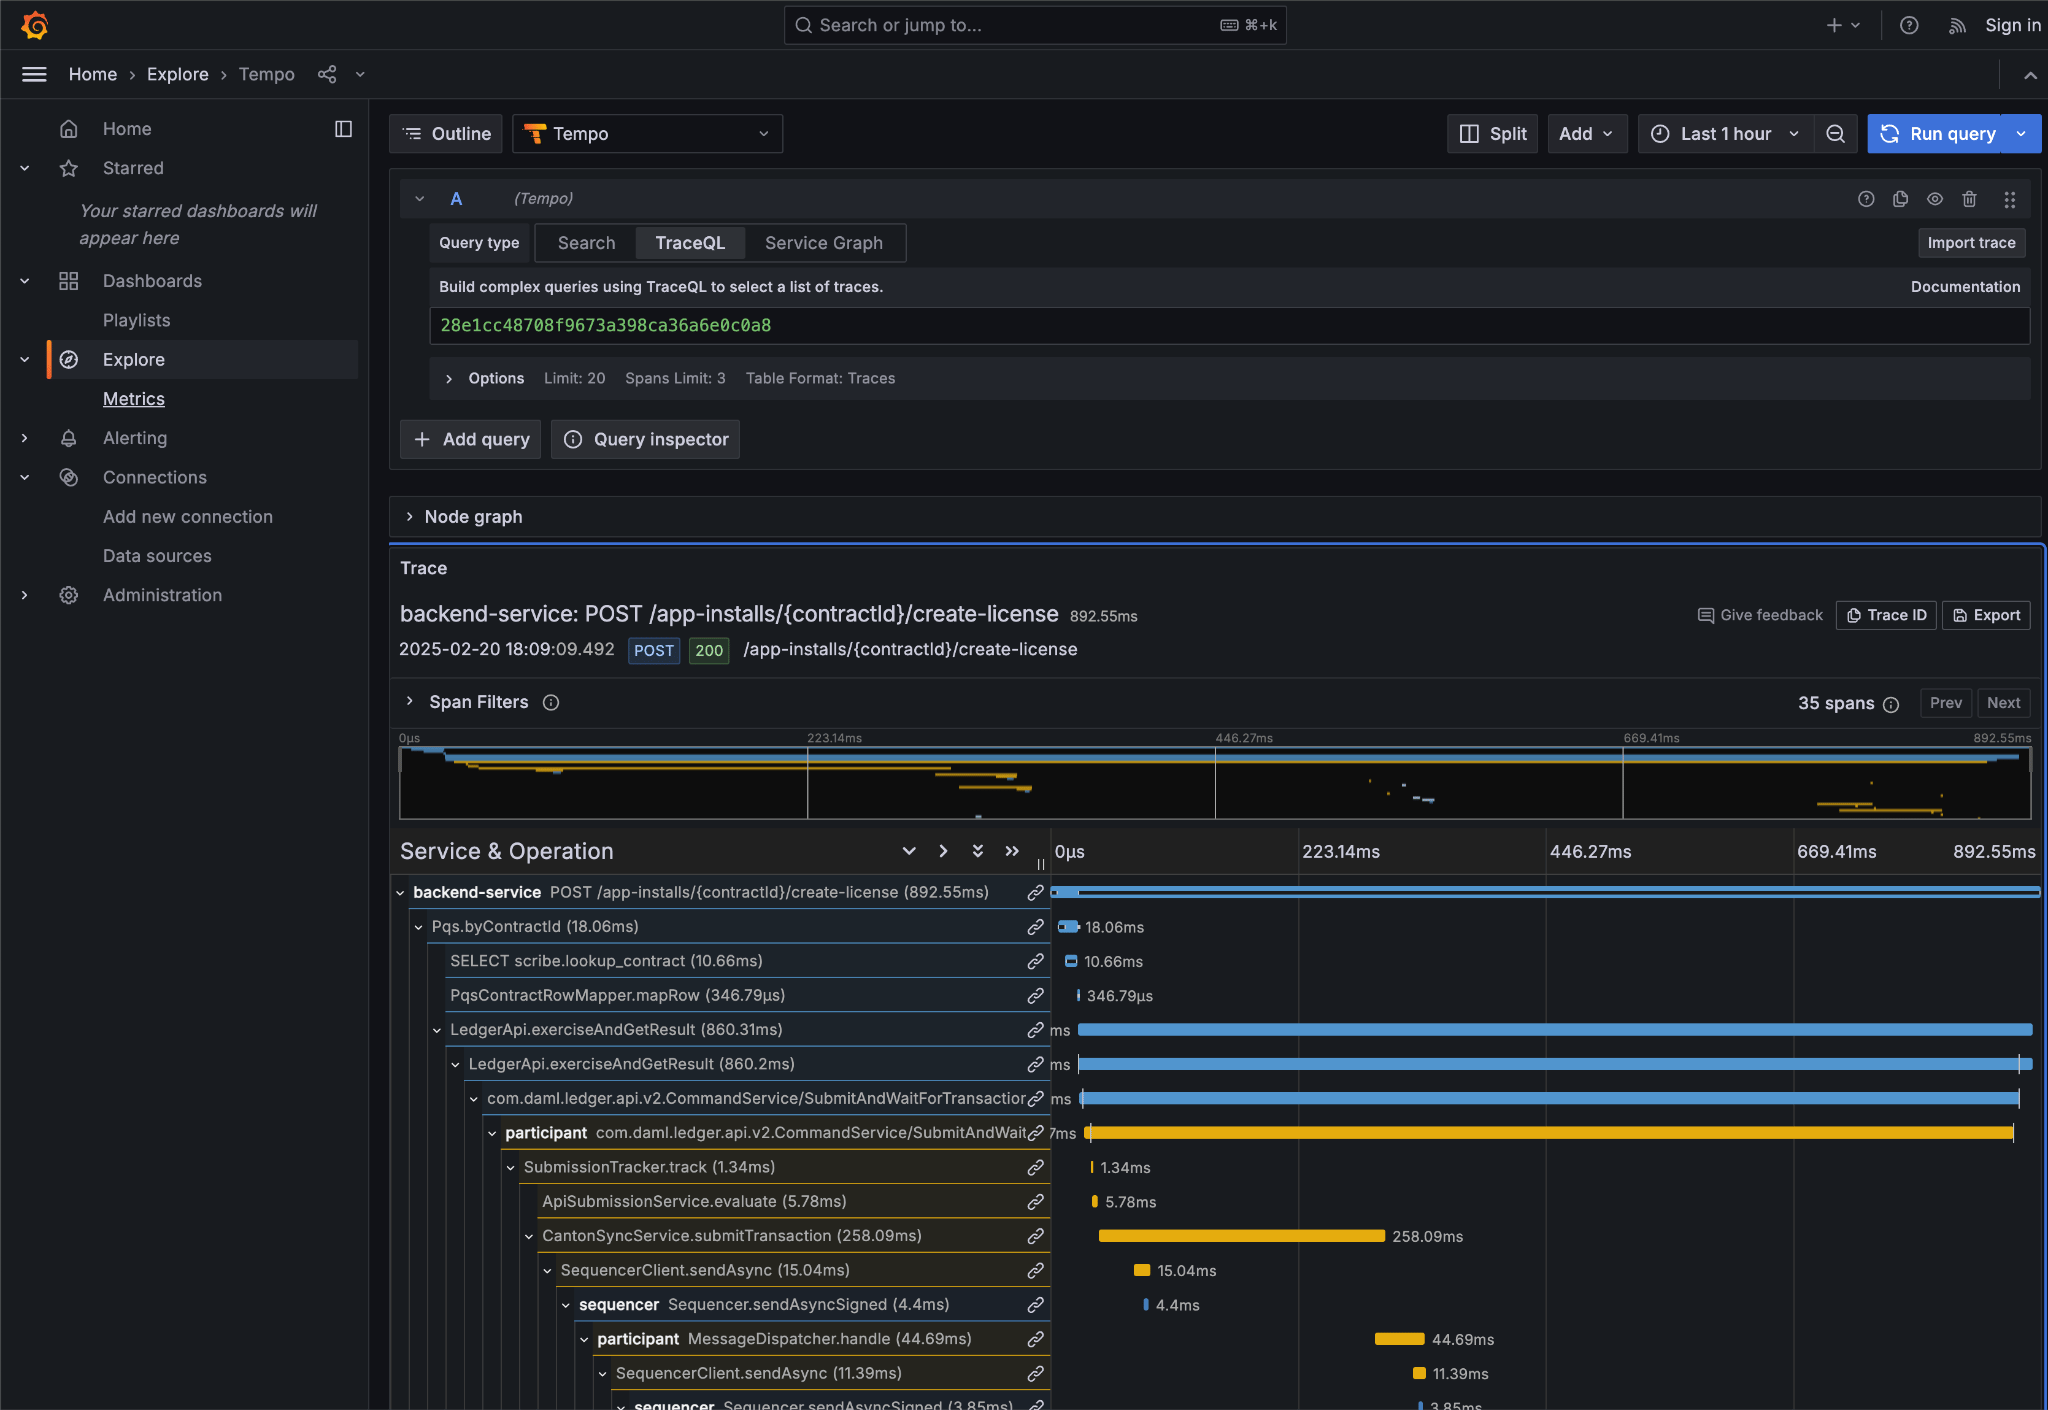
- Initial POST handler in the Backend Service
- Backend query against PQS to retrieve the AppInstall contract
- Call to the App-Provider Ledger API from the Backend Service
- Preparation of the Transaction by the Participant Node and submission to the Canton Network
- lnav: lnav download and documentation
- Tempo: https://grafana.com/docs/tempo/latest/traceql/
- Prometheus: https://grafana.com/docs/grafana/latest/datasources/prometheus/query-editor/
Footnotes
-
Specifically this sends a
CreateCommandto thesubmit-and-waitservice on the Application User’s participant node. ↩ - See the Canton Network Quickstart Guide “Project Structure” for more details on this ↩
-
Daml shell has tab completion on most command arguments, including the Template Id argument to
activeand the Contract Id argument to contract. ↩ -
Further documentation is available in the Daml Shell reference.
- A key differentiator of Canton from all other level one blockchains is that it offers privacy. It does this by enforcing right-to-know. rather than via secrecy-via-obscurity and/or via pseudo-anonymity. Canton provides two privacy guarantees: Even in encrypted form (sub-)transactions are only transmitted to participant nodes with a right to be informed of them; and, participant nodes will be informed of every (sub-)transaction they have a right to be informed of. For details on how Canton defines “right” and other aspects of this see the Daml ledger privacy model. ↩
- Distributed tracing is essential to efficient debugging and diagnosis of any distributed application. While technically distinct identifiers Trace and Span Ids are closely linked. If unfamiliar with their use OpenTelemetry has a good primer (https://opentelemetry.io/docs/concepts/signals/traces/), Grafana has a reasonable demo (https://grafana.com/docs/tempo/latest/introduction/), and we demonstrate their use later in this guide. ↩
- Equivalent to “blockheight” in other public blockchains that do not support privacy. As privacy dictates that each participant node sees a different projection of the global blockchain, the offset is not comparable across different Participant Nodes. It is commonly the preferred id when dealing with a single participant node due to being a simple, monotonic, total-order on ledger events witnessed by a Participant Node. ↩
- By virtue of their role in the ledger model, all parties are (and the associated entity must be) capable of authorizing a (sub-)transaction or ledger event. See the Daml ledger authorization model for details. ↩
- Where loggers cannot be configured to emit structured logs directly, log parsers are used to convert raw log files in the usual manner. This is primarily done in the OTEL Collector configuration. ↩
- This is an example of an important feature of the Canton Network. The participant node is only aware of the existence of this transaction because it is authorized to be informed of the transaction by the relevant Daml Smart Contracts and the privacy semantics of the Daml Ledger Model. Privacy is guaranteed, not because the contract data is obscured as cyphertext; but, because the ledger model ensures participants without a verified right to know do not receive the transaction in any form. ↩